
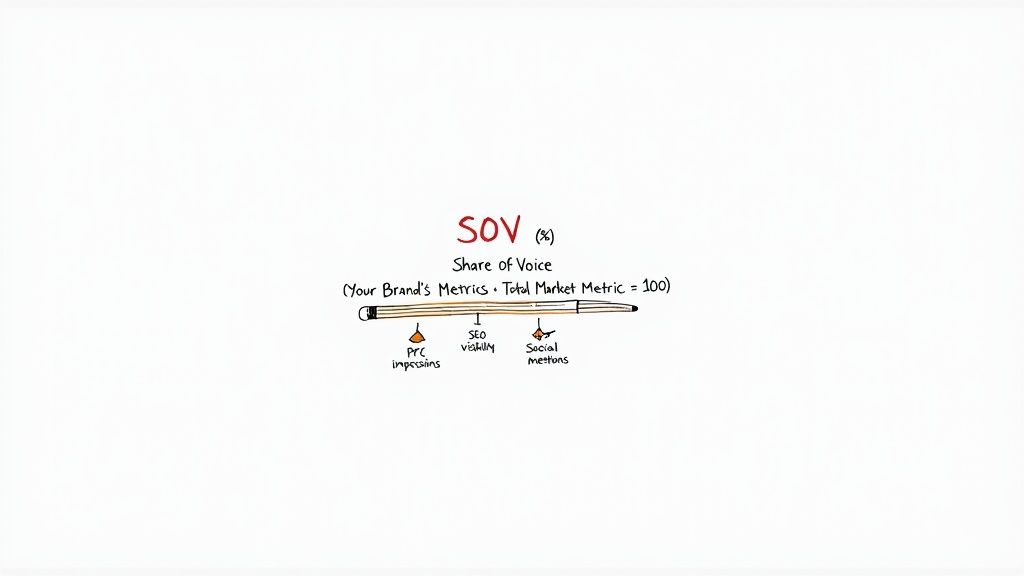
At its heart, figuring out your Share of Voice comes down to a simple, powerful formula:
SOV (%) = (Your Brand's Metrics / Total Market Metrics) × 100
The trick, of course, is defining those "metrics." The specific data you plug into this formula will look completely different depending on whether you're analyzing Google Ads, organic search results, or social media chatter.
Your Quick Guide to Calculating Share of Voice
Before you get lost in the weeds of complex analytics, it's critical to understand the basic building blocks of SOV. This isn't some universal, one-size-fits-all number. Its meaning—and how you calculate it—morphs depending on the digital arena you're measuring.
Think of it like tuning a radio. You have to find the right frequency (your metric) for each station (your channel) to get a clear signal.
Share of Voice is really about quantifying how much of the conversation your brand owns compared to everyone else in your space. It's a concept that's been around since the 1960s, back when it was all about ad spend in print and TV. But as marketing went digital in the early 2000s, the way we measure it evolved dramatically.
Common Metrics Across Key Channels
To make this truly practical, let's nail down which metrics matter most on different channels. Getting this right is the single most important part of an accurate calculation.
- Paid Advertising (PPC): When it comes to paid ads, the gold standard is Impression Share. If you're running Google Ads, this data is served up to you directly. It tells you the percentage of times your ads were shown out of the total number of times they could have been shown.
- Organic Search (SEO): For SEO, you’re usually looking at organic visibility or click share. This is a bit more complex, as it involves tracking your ranking positions for a whole basket of target keywords and weighing them by their search volume.
- Social Media: On social platforms, the most common approach is to track brand mentions. You can also measure the volume of engagement (likes, shares, comments) around a specific topic, hashtag, or campaign.
The real secret to a meaningful SOV calculation is consistency. Pick the right metric for the channel, decide exactly who your competitors are, and then stick with those same data points over time. That’s how you uncover trends you can actually act on.
The marketing world is always changing, and so are the methods we use to measure our impact. To keep your strategy sharp, it’s always a good idea to consult a modern guide to Share of Voice calculation and see what's new.
Why Share of Voice Is More Than Just a Number
Before we get buried in formulas and spreadsheets, let’s talk about what Share of Voice (SOV) actually tells you about your brand’s health. If you see it as just another percentage on a dashboard, you're missing the whole story. Think of SOV as the pulse of your brand’s presence in an incredibly noisy market.
Picture a massive stadium, and every brand is shouting to be heard. A higher Share of Voice doesn’t just mean you’re the loudest. It means your message is actually cutting through the chaos, reaching the right people, and starting to shape the conversation in your favor. It’s a direct reflection of your authority and relevance.
A strong SOV isn't a vanity metric; it's a leading indicator of future growth. Decades of marketing research have proven there's a powerful link between a brand’s SOV and its market share. When your SOV outpaces your market share, you’re building a kind of brand gravity that almost always pulls in growth.
Beyond Mentions: The Different Flavors of SOV
Share of Voice isn't a one-size-fits-all metric. It changes and adapts depending on where you're measuring it. To calculate share of voice accurately, you first need to understand its different "flavors." Each one gives you a unique angle on your brand's visibility.
Looking at these different dimensions of SOV is like being a brand doctor—it helps you diagnose your strengths and weaknesses with real precision.
- Organic SOV: This is all about your visibility in search engine results for your most important keywords. A high organic SOV means customers find you on their own terms, right when they're actively looking for answers.
- Paid SOV: In the world of paid ads, especially on platforms like Google Ads, this is usually called Impression Share. It shows you how often your ads are appearing compared to the total number of times they could have appeared. It’s a direct measure of your ad budget's firepower against the competition.
- Social SOV: This is the classic measure of brand buzz. It tracks how many people are talking about you—through mentions, hashtags, or specific conversations—versus your rivals. For brands using social listening tools like Replymer, this metric shows exactly how well you're inserting your product into relevant online discussions.
Your total Share of Voice is the sum of these parts. A competitor might be spending a fortune to dominate paid ads, but if you own the organic and social conversations, you could still hold a much stronger position in the minds of your customers.
From Visibility to Trust
At the end of the day, a dominant Share of Voice builds something far more valuable than just awareness—it builds trust.
Think about it from the customer’s perspective. When they repeatedly see your brand answering questions in Google, appearing in articles they trust, and being talked about on social media, you slowly become the default choice. You become the name they think of first.
This constant, helpful presence creates a powerful psychological edge. People naturally lean toward what’s familiar. A consistently high SOV makes your brand feel like the industry standard, which makes the buying decision that much easier for your customers.
Calculating SOV Across Your Digital Channels
Alright, let's roll up our sleeves and get practical. Understanding the theory is one thing, but knowing exactly how to calculate share of voice on the channels that actually drive your business—that’s where the real value is. Each platform speaks a slightly different language, so we have to adapt the "metrics" in our core formula to fit each one.
We're going to walk through the specific formulas, data sources, and real-world examples you'll need for PPC, SEO, and social media. This will give you a clear, repeatable process for measuring your brand's presence where it counts.
This simple flow shows how getting more visibility—driven by a higher SOV—builds brand trust, which is what ultimately leads to sustainable business growth.
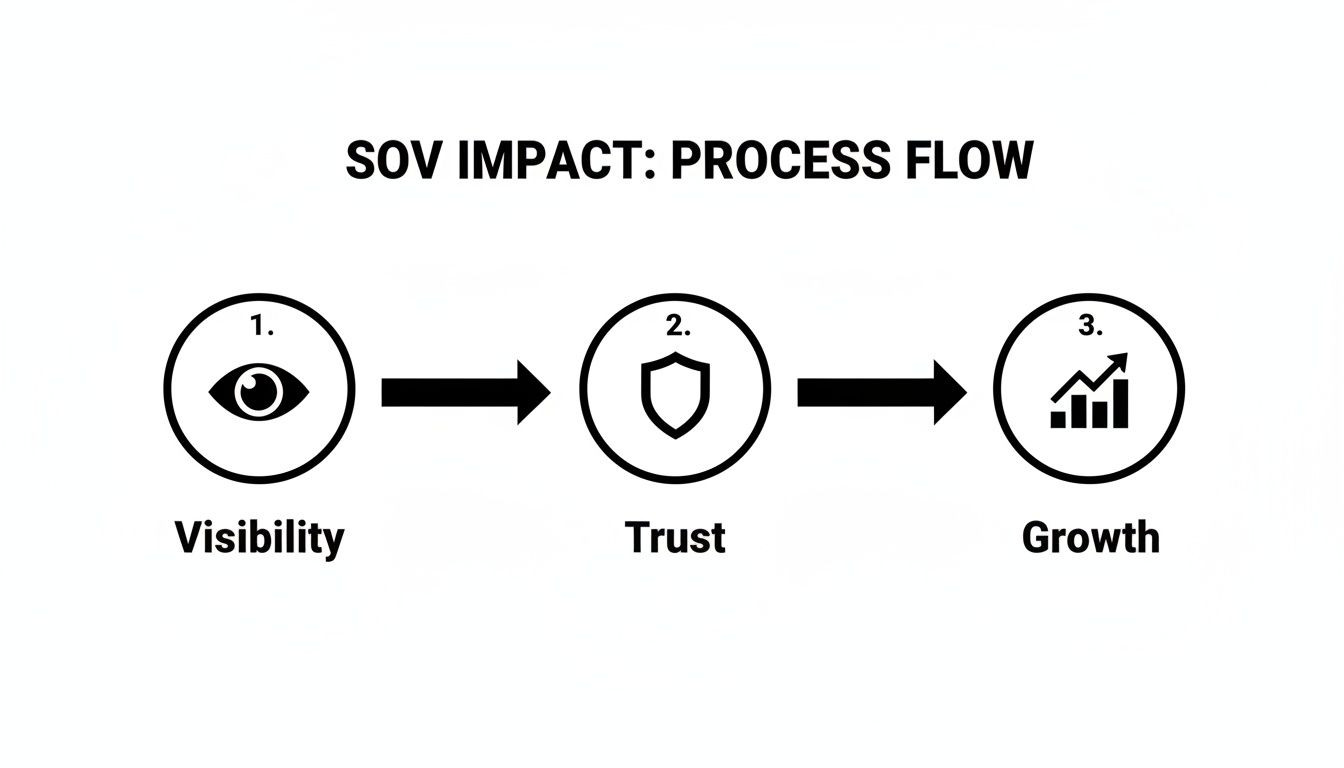
The key takeaway here is that SOV isn't just some fluffy awareness metric. It's the first domino in a chain reaction that builds a solid foundation for long-term success.
PPC Share of Voice with Impression Share
When it comes to pay-per-click advertising, the calculation is refreshingly straightforward. This is all thanks to the data that platforms like Google Ads give us directly. The main metric you'll focus on is Impression Share.
The formula is as simple as it gets:
PPC SOV = (Your Ad Impressions / Total Eligible Impressions) x 100
The best part? You don't even have to calculate this yourself. Google Ads provides this metric right in your campaign reports, telling you exactly what percentage of potential impressions you actually captured.
Worked Example:
Let's say you're running a campaign for "ergonomic office chairs." Google reports that your ads were shown 5,000 times. However, based on your targeting and budget, they were eligible to be shown 20,000 times. Your Impression Share, and therefore your PPC SOV for that campaign, is 25%.
This instantly tells you that your competitors are gobbling up the other 75% of potential ad views. Right away, you can see a huge opportunity to either increase your budget, improve your ad quality, or refine your bids to claim more of that available space.
SEO Share of Voice for Organic Visibility
Calculating SOV for SEO is a bit more of an art. "Visibility" isn't a single, clean number you can just pull from a report. It's really a blend of keyword rankings, search volume, and the estimated click-through rates (CTR) for those positions. After all, a #1 ranking for a keyword with 100 monthly searches is far less valuable than a #3 ranking for a term with 50,000 searches.
Here’s the conceptual formula you’ll be working with:
SEO SOV = Your Brand's Click Share / Total Click Share for a Set of Keywords
To get this number, you're going to need a dedicated SEO tool like Semrush or Ahrefs. These platforms track an enormous list of keywords, monitor your rankings against competitors, and use search volume and average CTR data to estimate your "share of traffic" or "visibility score."
- Define Your Keyword Set: Start by building a list of your most important commercial and informational keywords. This is your battleground.
- Track Your Rankings: Keep a close eye on your site's position for every keyword in that set.
- Estimate Traffic: The tool does the heavy lifting, multiplying each keyword's search volume by the estimated CTR for your ranking position to calculate your slice of the traffic pie.
Your SEO SOV is your estimated traffic from that keyword set, shown as a percentage of the total estimated traffic available for all competitors ranking for those same terms.
Social Media Share of Voice Through Mentions
On social media, SOV is all about the conversation. Here, you're measuring how often your brand is being talked about compared to your direct competitors. The most common metric for this is brand mentions.
The formula looks like this:
Social SOV = (Your Brand Mentions / Total Market Mentions) x 100
We've come a long way from the days of manually counting mentions. According to 2024 data from Talkwalker, tech giants like Apple maintain a massive 42% SOV in smartphone discussions on X (formerly Twitter). In the PPC world, Google Ads stats from 2024 show that top automotive advertisers like Toyota averaged a 28% impression share globally, capturing 28% of all eligible ad slots.
To get this data, you absolutely need a social listening tool. Manually searching is a recipe for inaccurate and incomplete data. These tools automate the tracking of your brand name, competitor names, and relevant hashtags across all major platforms. And for brands that want to do more than just listen, services like Replymer help you actively participate in those conversations.
It's also a good idea to find tools that serve as effective Google Alerts alternatives. This ensures you're catching mentions on blogs, forums, and other corners of the web that major social networks miss.
Worked Example:
Your social listening tool shows that over the last month, your brand was mentioned 1,200 times. Your two main competitors were mentioned 2,000 and 800 times, respectively.
The total market mentions are 1,200 + 2,000 + 800 = 4,000.
Your Social SOV = (1,200 / 4,000) x 100 = 30%.
Choosing the Right Tools for Accurate SOV Measurement
Trying to calculate your share of voice with guesswork and messy spreadsheets is a recipe for frustration. To get reporting that’s genuinely insightful, you need to build the right tech stack. The tools you pick will make or break the quality of your data and, ultimately, the strategic decisions you make with it.
A good platform does more than just spit out numbers; it provides context. It helps you understand not just what people are saying, but who they are, where the conversation is taking place, and how your buzz stacks up against the competition. This is the real foundation for measuring SOV effectively.
Tools for Organic Search Visibility
When you're talking SEO, the main goal is to figure out your organic visibility and, ideally, your share of clicks. This means you need a platform that can track a huge list of keywords and give you a solid estimate of traffic. For this, tools like Ahrefs and Semrush are pretty much non-negotiable.
They do way more than just tell you where you rank. By factoring in things like keyword search volume and average click-through rates, they give you a much more meaningful "visibility score" or "share of traffic" percentage. That's the closest you'll get to a true SEO share of voice.
Platforms for Social Media Listening
On social media, it's all about tuning into the conversation. You'll need a powerful social listening tool that can keep tabs on mentions of your brand, your competitors, and any relevant hashtags—all in real time and across the platforms that matter to you.
- Comprehensive Listening: Enterprise-grade solutions like Brandwatch or Sprout Social are fantastic for casting a wide net. They pull in massive amounts of data and give you detailed analytics on mention volume, sentiment, and reach, which is perfect for deep competitive analysis.
- Action-Oriented Engagement: But what if you want to do more than just listen? For teams that need to find relevant discussions and jump in, services like Replymer are a game-changer. They help you participate authentically, which directly grows your SOV by making you part of the conversation.
Most strong strategies actually use a mix of tools. If you're trying to figure out what's out there, this social media monitoring tools comparison is a great resource to find something that fits your team's budget and goals.
The best tool for you depends entirely on what you're trying to achieve. Are you focused on high-level competitive benchmarking, or do you need to find and engage in specific conversations to drive growth? Your answer will guide your investment.
Native Ad Platform Data
Don't forget about the goldmine of data sitting right inside your ad platforms. When it comes to paid SOV, these are your most direct and accurate sources of truth.
For truly accurate SOV measurement across various digital channels, it's essential to select the right best social media analytics tools. In Google Ads, for instance, you have the Impression Share metric built right into your campaign reports. This tells you the exact percentage of potential ad views you actually captured—a crystal-clear measurement of your paid SOV. In the same way, Meta Business Suite gives you reach and impression data that you can use to benchmark against what you know about your competitors.
Turning Your SOV Numbers Into a Winning Strategy
So, you’ve put in the work and calculated your share of voice. Now what? The raw number is just a starting point. The real magic happens when you translate that data into a sharp, competitive strategy that actually grows your business.
Think of your SOV figure as a map. It shows you where you stand right now, but it’s up to you to analyze the terrain and plot your next move. Just reporting the number is a massive missed opportunity; using it to outmaneuver your rivals is the entire point.
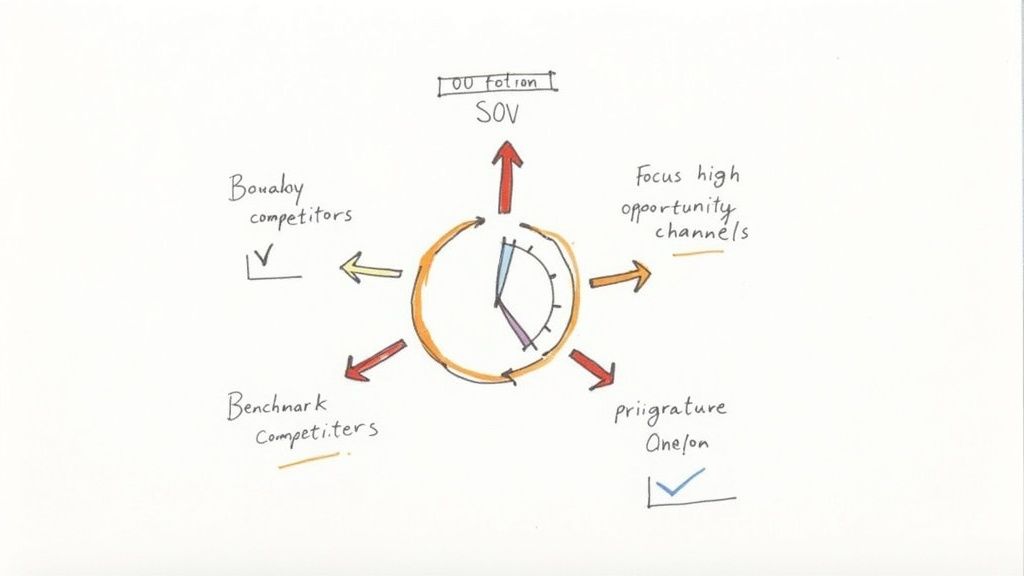
Benchmark to Find Your True Position
Your SOV means very little on its own. It only becomes valuable when you see it alongside your competitors' numbers. Are you the quietest voice in the room or the loudest? Benchmarking gives you that crucial context.
Start by comparing your SOV on a channel-by-channel basis. You might be surprised to find your 30% social media SOV is actually industry-leading, while your 10% in organic search is dangerously low.
This side-by-side view instantly turns a simple metric into a strategic diagnostic tool. It pinpoints exactly where you’re winning and where you’re vulnerable, telling you where to put your resources for the biggest impact.
This kind of analysis helps you shift from vague goals like "increase brand awareness" to specific, measurable missions. Your new objective might be to "capture an additional 15% of the SEO conversation from Competitor X over the next quarter." The whole process feels more concrete when you can see your progress laid out on a comprehensive social media dashboard for analytics.
Spot Opportunities and Threats
With your benchmarks laid out, you can start hunting for strategic openings. Look for the channels where your main competitors are suspiciously quiet. Is there a social platform they’re ignoring or a content format they haven’t explored?
This is where you can make a huge impact. A small, focused investment in an overlooked area can lead to a massive SOV gain, giving you a strong foothold in a new part of the market.
On the flip side, you need to identify where your competitors are dominant. If a rival owns 60% of the PPC conversation, trying to beat them head-on with a smaller budget is probably a losing fight. Instead, your SOV data might signal that it’s smarter to pivot and double down on your strengths in organic content or community building.
Understand Excess Share of Voice
One of the most powerful concepts you’ll encounter here is Excess Share of Voice (eSOV). This is simply the difference between your Share of Voice and your Share of Market. For instance, if you have a 15% market share but a 20% Share of Voice, your eSOV is +5 percentage points.
Why does this matter? Decades of research show a clear link between a positive eSOV and future market share growth. It's a leading indicator that your brand's presence is out-punching its current size. Aiming for an SOV that’s higher than your market share is a proven strategy for building long-term brand equity and, ultimately, driving more sales.
A Few Common Share of Voice Questions
Once you get into the weeds of tracking Share of Voice, you’ll inevitably run into some practical questions. The real world of marketing is messy, and knowing how to handle the nuances is just as important as the formulas themselves.
Let’s tackle some of the most common sticking points I see pop up.
How Often Should I Measure SOV?
This is always one of the first questions, and the honest answer is: it depends on how fast your industry moves.
For something like a fast-paced social media conversation or a highly competitive PPC auction, you might want to look at your SOV weekly, or even daily. Things change in an instant, and those quick check-ins can alert you to a shift you need to jump on.
But for slower-burn channels like organic SEO, a monthly or quarterly view is probably all you need. Looking at it too often will just have you chasing minor blips instead of focusing on the real, meaningful trends. The key is to pick a cadence that makes sense for your reporting and strategy sessions and then stick with it.
Can I Calculate SOV on a Small Budget?
What if you don't have the budget for a suite of enterprise-level listening tools? This is a huge concern for smaller teams, but the answer is a definite yes. You just have to be willing to get your hands a little dirty.
- For Social Media: You can get a solid directional feel by running manual searches on platforms like X or LinkedIn for your brand and your top competitors' names. It won't be perfect, but it's a great starting point.
- For Paid Ads: Google Ads gives you the Impression Share metric for free right inside your campaign reports. This is a direct, accurate measure of your SOV in the paid search arena.
- For Organic Search: Don't sleep on Google Search Console. It’s an incredibly powerful free tool that shows you impression and ranking data for your most important keywords.
Pulling this data into a simple spreadsheet takes more elbow grease, but it can paint a surprisingly clear picture of where you stand without costing a dime.
A quick reality check: is a 100% Share of Voice a realistic goal? Almost never. In any competitive market, it's virtually impossible to be the only one talking. A much smarter goal is to aim for 'Excess Share of Voice' (eSOV), where your SOV is greater than your actual market share. This imbalance is a well-documented leading indicator of market share growth.
Ready to stop just listening and start participating? Replymer uses human-written social replies to recommend your product in the right online conversations, turning everyday discussions into compounding demand for your brand. Grow your SOV on autopilot at https://replymer.com.


