So, what exactly are we talking about when we say social media dashboard analytics? Think of it as your command center. It’s where you gather, measure, and make sense of all the data pouring in from your social media accounts, all in one visual, easy-to-read place.
Instead of a jumble of likes, shares, and comments from different platforms, a dashboard weaves these metrics into a clear, actionable story about how your brand is doing, what your audience really wants, and whether your campaigns are actually hitting the mark.
Why Social Media Dashboards Are Your Command Center
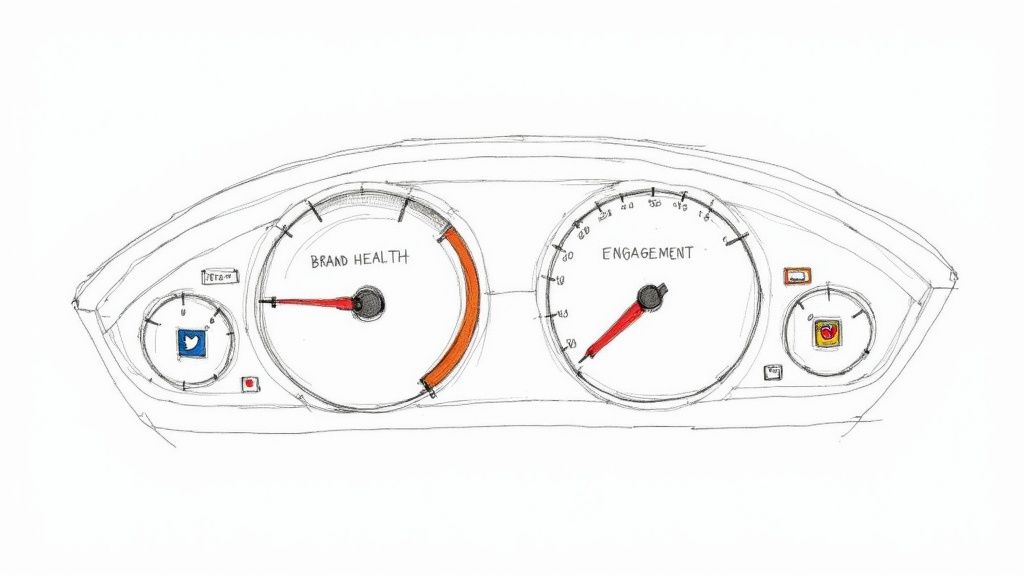
Trying to manage social media without a dashboard is like trying to fly a plane without an instrument panel. Sure, you’re moving, but you have no clue about your speed, altitude, or direction. A social media dashboard is that critical instrument panel for your entire digital strategy.
It pulls everything together. Instead of jumping between X (formerly Twitter), LinkedIn, and Instagram, a dashboard consolidates all your key data into a single view. That’s its superpower—it cuts through the noise and saves you from the soul-crushing task of manual reporting.
From Scattered Data to a Clear Story
The real magic of social media dashboard analytics is how it transforms raw numbers into a narrative that guides your next move. You stop just seeing metrics and start spotting trends, understanding what drives performance, and getting real-time answers to your biggest business questions.
A well-built dashboard helps you:
- Centralize Performance: See how all your channels stack up against each other, finally breaking down those data silos.
- Track Brand Health: Keep an eye on brand mentions, sentiment, and your share of voice compared to the competition.
- Measure Campaign Success: Go beyond vanity metrics to see how your campaigns are truly performing.
- Make Informed Decisions: Tweak your strategy based on hard data, not just a gut feeling.
A great dashboard doesn't just show you data; it tells a clear, visual story of how your social media efforts are bringing people to your website, generating leads, and ultimately, driving sales. This makes it a whole lot easier to justify your budget and prove your team's value.
The demand for these kinds of insights is exploding. The global social media analytics market was valued at USD 14.17 billion in 2025 and is expected to rocket to USD 95.64 billion by 2034. You can explore more data on this market growth to see just how fast it's moving.
This trend highlights a simple truth: if you’re not using a dashboard, you're flying blind.
Core Metrics That Truly Matter for Growth
Your social media dashboard is swimming with numbers, but let's be honest—not all of them really matter. Likes and follower counts might give you a temporary ego boost, but they're often just vanity metrics. They don't tell you anything about your impact on the business.
If you’re serious about growth, you need to zero in on the key performance indicators (KPIs) that connect what you do on social media to real-world results. These are the vital signs of your brand's health, showing you how your audience actually thinks, feels, and acts.
Essential Social Media Analytics Metrics Explained
To cut through the noise, we've broken down the metrics that growth teams should live and breathe by. These are the numbers that reveal the true story behind your social performance.
| Metric | What It Measures | Why It's Important for Growth Teams |
|---|---|---|
| Mentions | The total number of times your brand is named on social media, with or without a direct tag. | It’s your real-time brand visibility score. Spikes can signal a viral campaign or a PR crisis, giving you a crucial early warning. |
| Replies Published | The raw count of replies your team sends to mentions and comments. | This is a simple measure of your team's activity and output. It helps you track workload and ensure you're actively participating in conversations. |
| Reply Rate | The percentage of mentions that receive a reply from your team. | This metric proves you're listening. A high reply rate builds trust and loyalty, while a low one signals missed opportunities and frustrated customers. |
| Engagement | The sum of all interactions (likes, shares, comments, clicks) on your posts. | This shows if your content is actually resonating with your audience. High engagement means people are paying attention. |
| Reach | The total number of unique people who see your content. | Reach tells you how far your message is spreading. It’s the top of your funnel, measuring brand awareness and potential audience size. |
| Conversions | The number of users who take a specific, desired action after clicking a link (e.g., sign up, purchase). | This is the bottom line. Conversions directly link social media activity to revenue, proving the ROI of your efforts. |
Focusing on this set of metrics gives you a complete picture, from initial awareness (reach) all the way down to a final sale (conversion). Now, let's explore a few of the most critical ones in more detail.
Tracking Brand Visibility with Mentions
Think of mentions as the digital equivalent of hearing your name in a crowded room. Every time your brand is mentioned—whether you're tagged or not—it means you’re part of the conversation. Tracking this in your dashboard gives you a direct line into your brand's visibility and what people are really saying about you.
A sudden spike in mentions could mean a campaign just went viral. It could also be the first sign of a brewing customer service fire. This makes tracking mentions an indispensable early-warning system.
For a SaaS company, a rising number of mentions from developers on X discussing a specific workflow could reveal an untapped use case for their product. That insight, pulled straight from a dashboard, can directly shape the next product update or marketing campaign.
The need to track these conversations is exploding. The global social media analytics market was valued at around USD 10.26 billion in 2024 and is projected to hit USD 35.88 billion by 2030. You can discover more insights on the social media analytics market to see just how fast this space is growing. This trend hammers home just how critical it is for businesses to get a handle on these conversations.
Measuring Responsiveness with Reply Rate
If mentions show you where the conversations are happening, reply rate shows how well you’re showing up. This metric simply calculates the percentage of comments and mentions your team actually responds to. In a world where customers expect an answer five minutes ago, a high reply rate can be your secret weapon.
It’s proof that you’re listening and that you care. On the flip side, a low reply rate is a recipe for customer frustration and missed opportunities to build relationships. Smart growth teams set reply rate goals in their dashboards to make sure no customer is left hanging.
- What it tells you: How responsive and plugged-in your brand is with its community.
- Why it matters for growth: It builds incredible customer trust, boosts satisfaction, and gives you the power to shape the narrative around your brand.
Connecting Social to Sales with Conversions
At the end of the day, growth is about driving business results. That's where conversions come in. A conversion is any valuable action a user takes after clicking a link in one of your posts—signing up for a free trial, downloading an ebook, or making a purchase.
This is the metric that draws a straight line from your social media efforts to your company's revenue. By using tools like UTM parameters and connecting your dashboard to your web analytics, you can follow a customer's journey from a single tweet to a paid subscription. This is how you prove the ROI of your strategy and finally figure out which content truly gets your audience to act.
For a deeper look at this, check out our guide on how to measure social media engagement and connect it back to your business goals.
Building a Dashboard That Tells a Story
A great social media dashboard does more than just display charts and numbers—it acts as your command center. It should tell you a clear story about what’s working, what’s falling flat, and where your team should invest its time and energy next. The problem is, a dashboard that just dumps data on you without any context is nothing but noise.
The secret to a truly effective dashboard is building it with a specific purpose. Instead of getting bogged down tracking every metric under the sun, you need to align it directly with your business goals. This simple shift transforms it from a passive reporting tool into an active, strategic guide.
Start With Your Business Goals
Before you even think about dragging and dropping a single widget, you have to ask the most fundamental question: What are we actually trying to achieve here? Your answer will shape every decision you make from this point forward. A dashboard designed for brand awareness will look wildly different from one built to drive leads.
Let's say your team's main focus is brand awareness. In that case, you'll want to prioritize metrics that show how visible you are and how much of the conversation you command.
- Key Metrics: Reach, Impressions, and Share of Voice.
- The Story: "How far is our message spreading, and are we owning the conversation compared to our competitors?"
Now, flip that around. If your team is laser-focused on lead generation, you’re tracking actions that have a direct line to the sales pipeline.
- Key Metrics: Click-Through Rate (CTR), Conversions, and Cost Per Acquisition (CPA).
- The Story: "How good are we at turning social buzz into actual leads, and how much does it cost us to get each one?"
When you start with the end in mind, every single piece of data on your dashboard has a job to do. It’s there to answer a critical business question.
Design for Clarity, Not Complexity
Once your goals are crystal clear, it’s time to design a layout that pulls out insights, not just raw numbers. This is where solid data visualization comes in. A cluttered dashboard with a dozen charts all screaming for attention will just cause headaches.
Your dashboard should give you answers at a glance. If you have to spend ten minutes trying to figure out what a chart is telling you, the design has failed. The whole point is to make your most important KPIs pop.
A simple way to do this is by grouping related metrics together. Think logically. Use the right chart for the right data—line charts are fantastic for tracking trends over time (like follower growth), while bar charts are perfect for making direct comparisons (like engagement rates across different social platforms).
It’s also crucial to give your data some context. Sure, tracking your brand mentions is helpful. But it becomes infinitely more powerful when you see how that number stacks up against your top two or three competitors. This is where combining your dashboard analytics with other data sources really pays off. For a closer look at this, our guide on social listening tools comparison can show you how to benchmark your performance like a pro.
By focusing first on your goals and then designing for absolute clarity, you’ll build a dashboard that doesn't just report on what happened last week—it gives you a clear roadmap for what to do next.
Turning Your Analytics into Actionable Insights
So you've got a dashboard brimming with data. That's a great start, but it's just the first step. The real magic happens when you move beyond just seeing the numbers and start understanding the story they tell. This is where you graduate from passively collecting data to actively using it to make smarter, faster decisions.
The art of interpretation is really about connecting the dots. A sudden spike in engagement isn't just a pretty number; it’s a clue. Your job is to play detective and trace it back to the source. Was it that new ad campaign you launched on Tuesday? Or maybe an influencer gave you an unexpected shout-out? When you start asking "why" behind every metric, you uncover the cause-and-effect relationships that truly drive your growth.
Spotting Meaningful Trends and Patterns
Think of your dashboard as a treasure map—you just need to know how to read it. The secret is to look for patterns over time, not just isolated daily spikes.
Is your reply rate consistently tanking on weekends? That’s a clear sign you might need better weekend support coverage. Are mentions for a specific feature request climbing month after month? Congratulations, your audience just handed you a piece of your product roadmap.
True insight lives in context. A 5% engagement rate doesn't mean much in a vacuum. But a 5% engagement rate when your biggest competitor is only pulling in 2%? Now that's a competitive advantage you can lean into.
To start unearthing these gems, ask yourself a few simple questions every time you open your dashboard:
- What changed? Pinpoint any significant jumps or drops in your key metrics.
- Why did it change? Link that data point to a specific event—a campaign, a piece of content, or maybe something happening in the news.
- Is this good or bad? Measure the result against your own goals and past performance.
- What's our next move? Decide if you should double down on what’s working or go back to the drawing board on what isn't.
From Observation to Strategic Action
Following this simple process transforms your dashboard from a static report into a powerful decision-making engine.
For example, let's say you trace a wave of negative sentiment back to a recurring customer support complaint. You haven't just found a social media problem; you've identified a critical business issue that needs a real fix. Acting on that insight doesn't just improve your brand's reputation—it improves your product.
This shift toward data-driven strategy is exactly why the market for these tools is exploding. The global market is projected to skyrocket from USD 16.53 billion in 2025 to nearly USD 61.95 billion by 2032. You can discover more insights about social media analytics market growth and see how heavily companies are investing in this.
Ultimately, every single piece of data on your dashboard should have to justify its existence by leading to a clear, actionable next step.
4. Social Media Dashboard Templates for Different Business Goals
A one-size-fits-all dashboard is a recipe for getting lost in the weeds. If you really want to get value from your social media analytics, you need a view tailored to a specific business goal. Instead of staring at a blank slate, you can lean on proven templates designed for common challenges, making sure every metric you track actually has a purpose.
This approach stops your dashboard from being a data graveyard and turns it into a focused, decision-making command center. Think of each template as a specialist, giving you the precise information needed to answer critical questions about brand health, campaign success, or customer support quality—without all the distracting noise.
The best dashboards don't just show you data; they guide you from seeing what's happening to deciding what to do next.
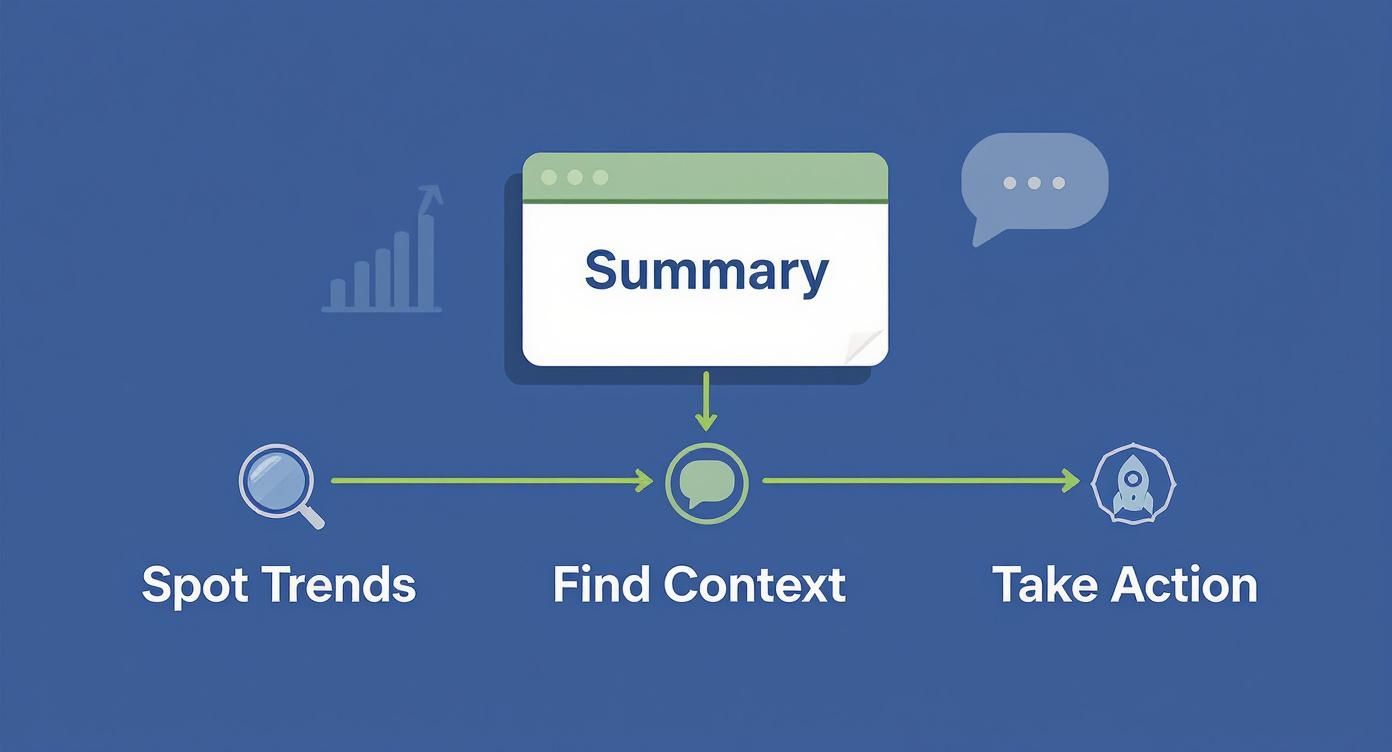
This workflow is the core idea: a good dashboard helps you spot trends, understand the context behind them, and take action with confidence.
Social Media Dashboard Templates for SaaS
To get you started, here’s a quick breakdown of three essential dashboard templates that are particularly useful for SaaS and growth-focused teams.
| Dashboard Template | Primary Goal | Key Metrics to Include |
|---|---|---|
| Brand Health | To monitor audience sentiment, brand reputation, and competitive positioning in real-time. | Sentiment Analysis, Share of Voice, Mention Volume. |
| Campaign Performance | To track the direct impact of specific marketing initiatives, from reach to conversion and ROI. | Reach & Impressions, Click-Through Rate (CTR), Conversions, Cost Per Acquisition (CPA). |
| Customer Support | To measure the speed, quality, and efficiency of customer interactions on social channels. | Reply Rate, Average Response Time, Resolution Rate. |
Each of these templates serves a distinct function, helping different teams within your organization focus on the numbers that matter most to them.
The Brand Health Dashboard
This dashboard is your brand’s real-time reputation monitor. Its main job is to measure how your audience perceives you out in the wild, helping you protect your brand image and understand where you stand in the market. It’s less about clicks and much more about conversations.
- Primary Goal: To keep a pulse on audience sentiment and your competitive positioning.
- Key Metrics to Include:
- Sentiment Analysis: This tracks the ratio of positive, neutral, and negative mentions. Are people happy, mad, or indifferent?
- Share of Voice: This measures your brand’s mentions compared to your top competitors. Are you dominating the conversation?
- Mention Volume: This shows the total number of conversations about your brand over time. Is the buzz growing or fading?
For instance, a marketing team could use this dashboard to see if a recent product update caused a spike in negative sentiment. By catching it early, they can jump in and address the issue before it spirals into a bigger problem.
The Campaign Performance Dashboard
When you launch a new marketing campaign, you need a dashboard that cuts straight to the results. This template is purpose-built to measure the direct impact of a specific initiative, from its initial reach all the way down to the final conversion.
A campaign dashboard should tell a clear story of ROI. It connects your ad spend and creative efforts directly to tangible business outcomes like leads or sales, making it easy to prove what’s working.
- Primary Goal: To track the reach, engagement, and conversion of specific marketing campaigns.
- Key Metrics to Include:
- Reach and Impressions: Shows how many unique users saw your campaign content and how many times they saw it.
- Click-Through Rate (CTR): Measures how compelling your call-to-action is. Are people actually clicking?
- Conversions and Cost Per Acquisition (CPA): Tracks how many users completed the desired action (like a sign-up or purchase) and how much it cost you to get them.
A growth team at a SaaS company might use this to compare two different ad campaigns on LinkedIn. By seeing which one delivers a lower CPA, they can quickly reallocate their budget to the higher-performing creative and maximize their return.
The Customer Support Dashboard
Social media is often the first place customers go to ask for help or complain. This dashboard is designed for support teams to monitor their responsiveness and effectiveness, helping them turn public frustrations into positive experiences. It’s all about speed, efficiency, and customer satisfaction.
- Primary Goal: To measure the speed and quality of customer interactions.
- Key Metrics to Include:
- Reply Rate: The percentage of inbound mentions that actually get a response. Are you ignoring anyone?
- Average Response Time: How quickly your team replies to customer inquiries. Speed matters in the public square.
- Resolution Rate: The percentage of issues successfully resolved through social channels. Are you just replying, or are you actually solving problems?
Proving Social Media ROI with Your Dashboard
Connecting your team's hard work on social media to the company's bottom line is the final—and most critical—piece of the puzzle. Likes, shares, and retweets feel good, but executives and stakeholders need to see a clear return on investment (ROI). Your social media dashboard is how you tell that story with cold, hard data.
This is where you graduate from simply measuring conversations to tracking actual conversions. The real goal is to build a business case for your social strategy that proves its direct contribution to revenue, using numbers that everyone from the CFO to the sales team can understand.
Connecting Social Activity to Business Results
The best way to follow a customer's path from a social post to a purchase is by using UTM parameters. Think of them as little breadcrumbs you add to the end of your URLs. They tell your analytics tools exactly where a visitor came from.
When you use UTMs consistently, your dashboard can map out the entire customer journey. You can pinpoint which posts are driving the most website traffic, which campaigns are generating the most free trial sign-ups, and even which platforms deliver customers with the highest lifetime value. It all becomes crystal clear.
A well-configured dashboard doesn't just show you metrics; it illustrates a clear path from social media engagement to revenue. This transforms the conversation from "we got a lot of likes" to "this campaign generated $15,000 in new sales."
To really nail this, you have to get the fundamentals right. For a complete walkthrough, our article on how to calculate marketing ROI breaks down the entire process step-by-step.
Building a Bulletproof Business Case
Armed with this data, you can finally demonstrate the tangible value of what you do. Your dashboard becomes the undeniable proof that justifies your budget and showcases your team's strategic impact on the business.
Here’s how you can use your dashboard to build a compelling case:
- Showcase Conversion Funnels: Visually map how a user goes from seeing a tweet to becoming a paying customer.
- Highlight Top-Performing Content: Pinpoint the exact posts and campaigns that drive the most valuable actions, proving what truly connects with your audience.
- Track Cost Per Acquisition (CPA): Show exactly how efficiently your social strategy is bringing in new customers compared to other marketing channels.
The measurable results you pull from your dashboards are powerful. They’re the kind of data-backed achievements you need when you build a marketing portfolio that lands you a job. This approach proves you know how to drive real growth, making you an invaluable asset to any team.
Frequently Asked Questions
Jumping into social media analytics can feel like learning a new language. You've got the dashboard, you see the numbers, but what does it all really mean for your day-to-day? Let's clear up some of the most common questions that pop up.
How Often Should I Check My Dashboard?
This is a classic question, and the honest answer is: it depends on your job. There’s no magic number, but having a routine is what separates those who are overwhelmed by data from those who are empowered by it.
Think of it as different levels of zoom.
Daily Check-in (5-10 minutes): This is for the folks on the front lines, like community managers. You’re not doing a deep dive; you’re scanning for emergencies. Is there a sudden burst of negative comments? A customer with an urgent problem? This is your daily pulse check.
Weekly Review (30 minutes): Marketing managers, this one’s for you. It’s your time to look at what worked and what didn’t last week. How did that new campaign land? Are engagement rates up or down? This is where you make small adjustments to your game plan.
Monthly Strategy Session (1 hour): Get the team leads and stakeholders in a room (or on a call). This is the big picture view. You're analyzing long-term growth, seeing if you're hitting your main KPIs, and figuring out the actual ROI from all this hard work.
The real secret isn't how often you look, but that you look consistently. A regular rhythm turns your dashboard from a fire alarm into a compass, guiding your strategy forward.
What's the Difference Between Analytics and Social Listening?
This is a big one. They might show up in the same tool, but analytics and social listening are two totally different things. Getting the distinction is key to understanding your brand's place in the world.
Social media analytics is about looking in the mirror. It’s all about your channels and your performance. You’re tracking metrics like engagement rates, follower growth, and clicks on your posts. Essentially, it answers the question, “How are our posts doing?”
Social listening, on the other hand, is like opening a window to the world. It’s about tuning into conversations happening all over social media about your brand, your industry, and your competitors—especially when they don't @-mention you. It answers the bigger question, “What are people saying out there?”
Ready to turn social conversations into measurable growth without the manual effort? Replymer's done-for-you service and analytics dashboard give you the insights and engagement you need to grow on autopilot. Start your journey with Replymer today!


