So, what does "measuring social media engagement" actually mean? In simple terms, it's about tracking how your audience interacts with the stuff you post—likes, comments, shares, clicks, you name it. But it's more than just counting. It’s a process of setting clear business goals, picking the right metrics for each platform, calculating engagement consistently, and then using that data to make your content even better.
Why Measuring Engagement Is No Longer Optional

Let's get one thing straight: success on social media isn't just about racking up likes and followers anymore. Sure, those numbers look nice on a report, but they barely scratch the surface of what’s really going on. Real engagement is what shows you what your audience actually thinks and feels about your brand, and that's the feedback you need to create content that genuinely connects.
When you measure engagement consistently, social media stops being a simple megaphone and becomes a source of incredible business intelligence. It’s how you find out which topics ignite real conversations, what formats your audience loves, and how people truly perceive your brand over time.
Moving Beyond Vanity Metrics
Obsessing over follower count is like judging a book by its cover—it completely misses the story inside. High-quality interactions are worth so much more than passive views. Think about it: a post that gets 100 thoughtful comments is far more valuable than one with 10,000 likes and crickets in the comment section.
This means we have to dig into the quality of those interactions. A one-size-fits-all measurement strategy just doesn't work because a "like" on Instagram isn't the same as a detailed comment on a LinkedIn article. The effort and intent behind the action are totally different.
Key Takeaway: The goal isn't just to be seen; it's to be heard, understood, and remembered. Measuring engagement properly is the only way to know if your message is truly landing.
The True Value of Quality Interactions
To get this right, you have to understand the nuances between different actions. We've all heard of the traditional signals—likes, comments, shares, and reactions. Each one tells a different story about engagement intensity.
Shares, for example, carry way more weight than likes because they're a direct endorsement. Someone is willing to put their own reputation on the line to amplify your message. That's huge.
And with video dominating every feed, metrics like completion rates are now critical. A post with 10,000 views means nothing if everyone bails after the first five seconds. You have to look at these metrics together to get a clear picture of what's working. If you want to dive deeper, Sprout Social offers a detailed guide on the metrics that matter most.
By focusing on these deeper signals, you build a strategy that fosters real loyalty and drives business results. You stop just posting and start turning your social data into a serious competitive advantage.
Connecting Business Goals to Core Metrics
Measuring social media engagement just for the sake of it is a bit like driving without a destination. You'll see some interesting scenery, sure, but you'll never actually know if you got where you were supposed to be going. Before you even think about tracking a single like or share, you have to tie your social media work back to real business objectives.
So, what are you actually trying to accomplish? The answer to that question changes everything. A B2B SaaS company trying to establish itself as an industry leader is going to care a lot more about insightful comments on LinkedIn than it will about viral video views on TikTok.
From Business Objectives to Social KPIs
The first move is to translate those big, broad business goals into specific social media Key Performance Indicators (KPIs). This is where you go from fuzzy ideas to hard numbers you can actually track. "Increasing brand awareness" is a wish, not a goal. But "growing our share of voice by 15% quarter-over-quarter"? Now that's something you can measure.
Here's how that translation works for a few common goals:
- The Goal: Boost Brand Awareness. Your job is to get your brand name in front of more of the right people. You'll be focusing on metrics that scream visibility and reach.
- The Goal: Generate Leads and Drive Sales. This is all about getting people off of social media and into your sales funnel. Your metrics need to track actions that signal someone is interested in buying.
- The Goal: Enhance Brand Loyalty and Community. Success here means building a crew of dedicated followers who jump into conversations and go to bat for your brand.
Once you know what you're aiming for, you can pick the metrics that actually show you're making progress. This is absolutely critical for proving the value of what you do—and for ultimately understanding your return on investment. If you need a refresher, our guide on how to calculate marketing ROI is a great place to dig into connecting marketing activities to business outcomes.
Choosing Metrics That Matter for Each Goal
Let's be clear: not all metrics are created equal. A "like" is a low-effort head nod. A "share" is a powerful endorsement. Grasping this difference is fundamental to measuring engagement in a way that actually means something.
For a B2B brand, one thoughtful comment from a key decision-maker on a LinkedIn article can be more valuable than a thousand likes on an Instagram post. Context and quality trump raw volume every time.
To make this crystal clear, I've put together a table that maps common business goals to the engagement metrics that truly reflect progress.
Matching Business Goals to Key Engagement Metrics
Use this as a starting point to ensure the numbers you're tracking are directly tied to the outcomes you want to achieve.
| Business Goal | Primary Engagement Metric | Why It Matters | Example Platform |
|---|---|---|---|
| Brand Awareness | Reach & Impressions | Measures the raw visibility and spread of your content to new and existing audiences. | |
| Lead Generation | Click-Through Rate (CTR) | Shows how effectively your content persuades users to take the next step into your funnel. | |
| Community Building | Conversation Rate (Comments) | Highlights active participation and dialogue, crucial for fostering a loyal community. | |
| Audience Growth | Audience Growth Rate | Tracks the net increase in followers, indicating your brand's growing influence. | X (Twitter) |
| Content Resonance | Applause Rate (Likes, Saves) | A quick signal that your content is hitting the mark and appreciated by your audience. | |
| Competitive Edge | Social Share of Voice (SSoV) | Pits your brand's presence against competitors, revealing your market position. | All Platforms |
Choosing the right KPIs isn't just a setup step; it's an ongoing strategic decision that ensures your social media efforts are always aligned with the bigger picture.
Now, let's break down which specific metrics to obsess over for each of those goals.
If your goal is Brand Awareness, track:
- Reach & Impressions: The number of unique people who see your content versus the total times it was shown. If your reach is high among non-followers, it's a great sign your content is getting passed around.
- Audience Growth Rate: How fast are you gaining new followers? This is a straightforward indicator of your growing influence and appeal.
- Social Share of Voice (SSoV): This calculates your brand’s mentions versus your top competitors. It’s a powerful way to see how much of the conversation in your industry you actually own.
If your goal is Lead Generation, track:
- Click-Through Rate (CTR): What percentage of people who saw your post actually clicked the link? This is a direct measure of how compelling your call-to-action and creative are.
- Conversion Rate: Of the people who clicked through from social, how many completed a key action, like signing up for a demo or downloading a PDF? This is where the rubber meets the road.
- Cost-Per-Click (CPC): For any paid campaigns, this tells you how efficiently your ad dollars are working to drive traffic to your site.
If your goal is Community Building, track:
- Engagement Rate: The percentage of your audience that interacts with your content. You can calculate this based on reach or followers, but whatever you choose, stick with it for consistency.
- Conversation Rate: Simply put, the number of comments per post. For brands like ours that value authentic dialogue and replies, this metric is gold.
- Applause Rate: This bundles "approval" actions like likes, saves, or favorites. It gives you a quick read on what kind of content your audience genuinely appreciates, even if they aren't the chatty type.
By being picky with your metrics, you build a dashboard that tells a clear, focused story about your performance. You stop chasing empty numbers and start making smart, data-backed decisions that actually move the needle for your business. This is the foundation of any social media measurement strategy worth its salt.
How to Calculate Your Engagement Rate Accurately
Alright, you've connected your business goals to the right metrics. Now for the fun part: the math. But don't worry, calculating your engagement rate isn't about finding one single, magic formula. It’s about choosing the right calculation for the right situation and—most importantly—sticking with it so you can track your progress over time.
Different formulas tell you different stories about your content. Knowing which one to use, and when, is how you turn raw data into real insights. Let's walk through the three most common and useful ways to measure engagement.
Engagement Rate by Reach (ERR)
I often call this the "honesty metric." Engagement Rate by Reach (ERR) calculates the percentage of people who chose to interact with your content after actually seeing it. It completely sidesteps the noise of a fluctuating follower count or a punishing algorithm.
The formula is simple:
(Total Engagements / Total Reach) x 100 = ERR %
Let's say you post an update on LinkedIn that reaches 5,000 unique people and gets 250 total engagements (likes, comments, shares). Your ERR would be (250 / 5,000) x 100 = 5%.
This is probably the most accurate formula out there because it focuses only on the people who saw your post. Your follower count can be a vanity metric, but reach tells you about your true audience in that specific moment.
A word of caution, though: reach can swing wildly from post to post. A very low reach might inflate your engagement rate, so you have to look at the numbers with context. For reference, the average ERR on Instagram hovers around 3.00%, while Facebook is closer to 1.20%. It really shows you how much the benchmarks can vary by platform.
- When to Use It: ERR is your go-to for analyzing individual organic posts. It answers the question, "Of the people who saw this, what percentage cared enough to do something?"
Engagement Rate by Impressions (ERI)
While reach counts unique viewers, impressions count the total number of times your content was displayed on a screen. That means one person could be responsible for several impressions. Engagement Rate by Impressions (ERI) becomes incredibly useful when you're running paid campaigns, where you're often paying for every impression.
Here’s how you calculate it:
(Total Engagements / Total Impressions) x 100 = ERI %
Imagine your paid ad on X (formerly Twitter) was shown 20,000 times and racked up 400 engagements. Your ERI would be (400 / 20,000) x 100 = 2%.
- When to Use It: Pull out the ERI formula for paid social campaigns. It helps you figure out how effective your creative and targeting are on a cost-per-view basis and tells you if your content stays engaging even after someone has seen it a few times.
This decision tree is a great visual for how to connect your goals to your metrics before you even start crunching numbers.
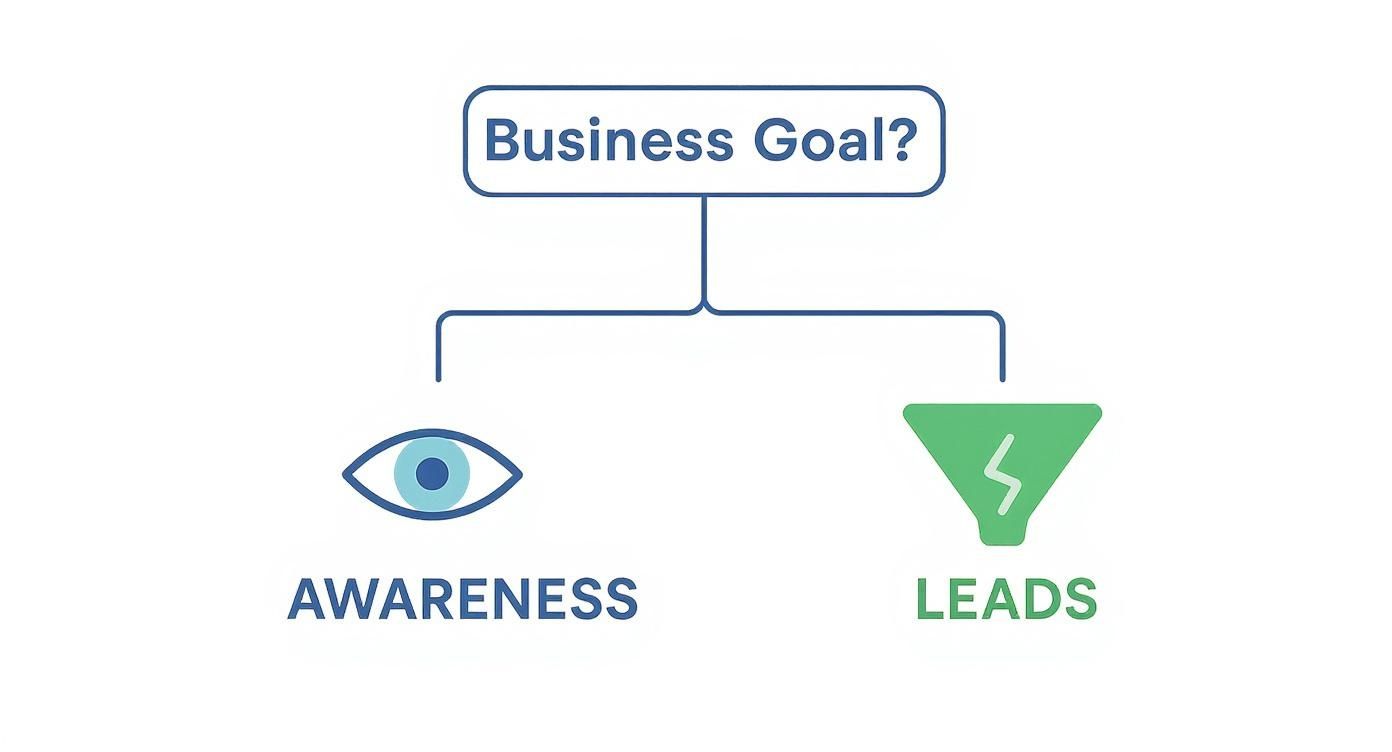
It really drives home the point that your measurement strategy has to be intentional from the very beginning.
Engagement Rate by Post (ERP)
You might also hear this called Engagement Rate by Followers. Engagement Rate by Post (ERP) measures what percentage of your followers engaged with a post. This used to be the industry standard, but its star has faded a bit as organic reach has plummeted across the board. The hard truth is, the algorithm simply doesn't show your content to all of your followers anymore.
Here's the formula:
(Total Engagements on a Post / Total Followers) x 100 = ERP %
If your brand has 10,000 followers and a post gets 300 engagements, your ERP is (300 / 10,000) x 100 = 3%.
- When to Use It: ERP is still a decent way to get a quick pulse check on your content's performance relative to your follower count. While it's not as precise as ERR for a single post, it offers a stable baseline for tracking the overall health and responsiveness of your community over time.
Pick a Lane and Stay In It
The single biggest mistake you can make is being inconsistent. Comparing this month's ERR to last month's ERP is like comparing apples to oranges—the numbers aren't telling the same story.
Key Takeaway: Choose the formula that best fits your primary goal—whether that's organic performance, paid campaign effectiveness, or general community health—and use it consistently. It's the only way to build reliable benchmarks and see if you're actually making progress.
For a deeper look at a specific platform, a guide on using an Instagram Engagement Rate Calculator can offer more tailored advice. But this principle of consistency is universal, whether you're dissecting complex B2B discussions on LinkedIn or eye-catching visuals on Instagram.
By applying these formulas with a clear purpose, you stop guessing and start knowing. You’ll be able to confidently pinpoint what content truly connects, back up your strategy with hard data, and make smarter decisions that actually move the needle.
Building an Actionable Reporting Dashboard

All the number-crunching in the world means nothing if you can't see the story behind the data. Raw numbers are just noise. A well-designed reporting dashboard is what transforms that noise into clear, actionable insights.
This isn’t about cramming every possible metric onto a single screen. The real goal is to build a focused command center that tells you exactly what happened, why it happened, and what you should do about it next. An effective dashboard gives you a consistent, repeatable way to track performance, so you’re making smart decisions based on trends, not just reacting to random viral posts.
The Anatomy of an Effective Dashboard
To really tell a complete story, your dashboard needs a few key elements. I like to think of it like a newspaper: you’ve got the big headline, the lead story, and then deeper sections for anyone who wants the full scoop.
First, start with a high-level executive summary right at the top. This is your at-a-glance overview of the most critical KPIs—think overall engagement rate, audience growth, and maybe a core business metric like referral traffic. It should immediately answer the question, "Are we winning?"
Next, you need to break down your performance by platform. This is where you get into the weeds, showing metrics that actually matter for each network. For LinkedIn, you might highlight the conversation rate on your thought leadership content. For X, you could zero in on reply volume and retweets from key people in your industry.
Finally, dedicate a section to your top-performing content. This is your highlight reel. Showcasing the top 3-5 posts based on your primary engagement metric (like Engagement Rate by Reach) instantly shows the entire team what’s actually connecting with your audience.
Tailoring Reports for Different Audiences
One of the biggest reporting mistakes I see is creating a single, one-size-fits-all dashboard. The information your CMO needs is completely different from what your social media manager needs to execute their daily tasks.
For the CMO (The "Why"): They care about business impact. Focus on ROI, how social is contributing to lead generation, and competitive metrics like your Social Share of Voice (SSoV). Keep it highly visual with simple charts that show trends over time.
For the Social Media Manager (The "What" and "How"): This report needs to be granular. We're talking engagement rate per post, best times to publish, and deep dives into comment sentiment. This is the tactical data that fuels day-to-day optimization.
When you tailor the report, everyone gets exactly what they need without being bogged down by irrelevant numbers. It makes your work more valuable and far more likely to drive real decisions. In fact, our guide on https://replymer.com/blog/social-media-for-lead-generation goes much deeper into tying these social activities to tangible business results.
Key Takeaway: A great dashboard doesn't just show data; it provides context. By structuring your report logically and tailoring it to your audience, you turn a spreadsheet of numbers into a compelling story about your brand's performance.
Choosing Your Reporting Tools and Cadence
With a solid structure in mind, it's time to pick your tools and get into a rhythm. You don't need a crazy-expensive system to get started. Honestly, a smart combination of native analytics and a good third-party tool can be incredibly powerful.
- Native Analytics (e.g., Meta Business Suite, LinkedIn Analytics): These are fantastic for platform-specific insights. They’re free, reliable, and come straight from the source.
- Third-Party Platforms (e.g., Sprout Social, Hootsuite): Tools like these are lifesavers for pulling data from multiple channels into one dashboard. They save hours of manual data entry and often have more advanced features for things like competitive benchmarking.
Once your tools are in place, establish a consistent reporting cadence. A quick weekly check-in is perfect for tactical tweaks, a monthly report is ideal for tracking progress toward your goals, and a quarterly review gives you the strategic, big-picture perspective you need.
Ultimately, you're aiming for a dashboard that’s both insightful and easy to digest. To make sure your charts are pulling their weight, it's always a good idea to brush up on some core data visualization best practices. This focus on clarity and consistency is what turns social media measurement from a chore into a truly valuable part of your strategy.
Benchmarking Performance to Refine Your Strategy
https://www.youtube.com/embed/1dAu4418o9g
So, you’ve built your dashboard and you're tracking your engagement rates consistently. Now comes the inevitable question that every social media pro asks themselves: "Okay, but are these numbers any good?"
Raw metrics are a fantastic start, but they don't tell the whole story without context. That's where benchmarking comes in. It’s how you figure out if your performance is just okay, or if you're truly knocking it out of the park.
Think of benchmarking not as a pass-or-fail test, but as your roadmap for improvement. It helps you set goals that are actually achievable, see how you stack up in your market, and make smarter decisions about what you post and where you post it.
Internal vs External Benchmarks
Your most important competitor is always your past self.
Internal benchmarking is simply comparing your current performance against your own historical data. How does this month's engagement rate look compared to last quarter's? Seeing an upward trend here is the purest sign of progress because you're the control group—it's your audience, your content, and your brand.
Then there’s external benchmarking, which involves measuring your metrics against industry averages or even your direct competitors. This can be super insightful, but it comes with a big caveat: compare with care. A B2B SaaS company’s idea of a "good" engagement rate on LinkedIn is worlds away from a B2C fashion brand’s on Instagram. You'll just get discouraged comparing apples to oranges.
Key Takeaway: Prioritize internal benchmarks to track your own growth and momentum. Use external data points to understand where you fit within your specific niche, not the entire social media universe.
Finding and Using Relevant Data
So, where do you get your hands on reliable external benchmarks? Industry reports are your best bet. Companies often publish studies breaking down engagement metrics by platform, industry, and region, giving you a much more useful point of comparison.
For example, recent data shows just how wildly these benchmarks can swing. Engagements on Instagram recently shot up by 28%, while Facebook saw a much smaller 9% increase. Diving in, you'll see huge regional differences, too. North American accounts might post less often but see high engagement in specific sectors like government, while brands in the APAC region post more frequently with massive engagement in sports. You can discover more insights about these industry benchmarks on Sprout Social to find data that actually applies to your situation.
When you're looking at competitors, stick to their public metrics. You can manually track the engagement on their top-performing posts or use a social listening tool to automate the process. This helps you understand your Social Share of Voice (SSoV). If you're ready to dig in, our guide on how to calculate share of voice breaks down exactly how to measure this critical competitive metric.
Turning Insights Into Action
Collecting benchmarks is pointless if you don't do anything with them. Once you've spotted trends and outliers in your data, it's time to put those insights to work. Your dashboard should be the command center for your content strategy.
Here’s how you can translate those numbers into real, tangible actions:
- Double Down on What Works: Did you notice that posts featuring user-generated content get twice the engagement? That's a clear signal to make it a central part of your content calendar. If video tutorials are crushing static images, it’s time to shift more resources toward video.
- A/B Test Your Creative: Use your current benchmarks as a baseline for experimentation. Start A/B testing different headlines, calls-to-action, or visual styles. See if a more conversational tone in your captions actually moves the needle on your comment rate.
- Adjust Your Timing: Is your engagement rate taking a nosedive on weekends? It might be time to reallocate your posting schedule to focus on weekdays when your audience is online and active. Dive into your platform analytics to find the exact days and times that drive the best results.
This cycle of measuring, benchmarking, and iterating is what separates good social media management from great. It turns your strategy from a series of educated guesses into a repeatable, data-driven engine for growth.
Even after you've got your formulas and dashboards set up, the real questions start to pop up. It's one thing to know the theory, but what do you do when the data from your latest campaign looks nothing like the textbook examples?
Let's dive into some of the most common hurdles I see teams struggle with. Think of this as the field guide for when things get messy.
What Is a Good Engagement Rate, Really?
This is the million-dollar question, isn't it? The honest-to-goodness answer is: it depends.
There's no single magic number. A "good" engagement rate is a moving target that shifts with your industry, the platform you're on, and who you're talking to. A B2B SaaS company might be thrilled with a 2% engagement rate on a dense, technical post on LinkedIn. Meanwhile, a travel brand could consider a 5% rate on a stunning Instagram photo as just their baseline.
Instead of getting hung up on a universal number, focus on these two things:
- Your Own Past Performance: The most important benchmark is you. Is your average engagement rate this month better than last month's? That upward trend is the clearest signal that what you're doing is working.
- Your Direct Competitors: Don't compare yourself to massive global brands. Look at companies in your specific niche. If a direct competitor is consistently getting double your engagement with similar content, that’s a huge signal to dig in, see what they're doing differently, and adapt your own strategy.
A "good" engagement rate is one that's consistently getting better over time. You'll get far more value from beating your own performance last quarter than you will from chasing a generic industry average.
Should Link Clicks Count as Engagement?
Ah, the classic debate. My take is that it depends entirely on what you wanted that specific post to achieve. Lumping clicks into your main engagement rate formula can be a problem because you're mixing two very different user intentions: appreciating the content (likes, comments) and taking an action on the content (clicks).
Here’s a simple way I recommend thinking about it:
- If your goal is Brand Awareness or Community Building: No. You want to know if the content itself is resonating and starting conversations. For that, stick to interactions like likes, comments, and shares. Clicks are a different story.
- If your goal is Lead Gen or Driving Traffic: Yes, but track it separately. For posts meant to get people to your website or a landing page, your Click-Through Rate (CTR) is the star of the show. You can absolutely create a secondary "Action Rate" that includes clicks, but don't let it muddy the waters of your primary engagement calculation.
Keeping them separate gives you a much cleaner, more honest picture of what each piece of content is actually accomplishing.
How Do I Measure Video Engagement the Right Way?
Let's be clear: views are a vanity metric. A video that gets 100,000 views but has everyone bouncing after three seconds is a total flop. To get a real sense of video performance, you have to look at the metrics that show people are actually watching.
I always tell teams to focus on these two metrics above all else:
- Average View Duration: This shows you how long people are sticking around. Is it 5 seconds or 55 seconds? A higher number means your content is genuinely holding their attention.
- Video Completion Rate: This is the gold standard. What percentage of people watched your video all the way to the end? A high completion rate is a powerful sign that you delivered on the promise you made in the first few seconds.
These two numbers tell a much more compelling story than a simple view count ever could. They show you not just if people started watching, but if they cared enough to finish.
Tired of manually searching for conversations to join? Replymer uses human-powered social replies to put your product in the right discussions on Reddit, X, and LinkedIn, turning authentic engagement into predictable growth. Learn how to grow on autopilot.


