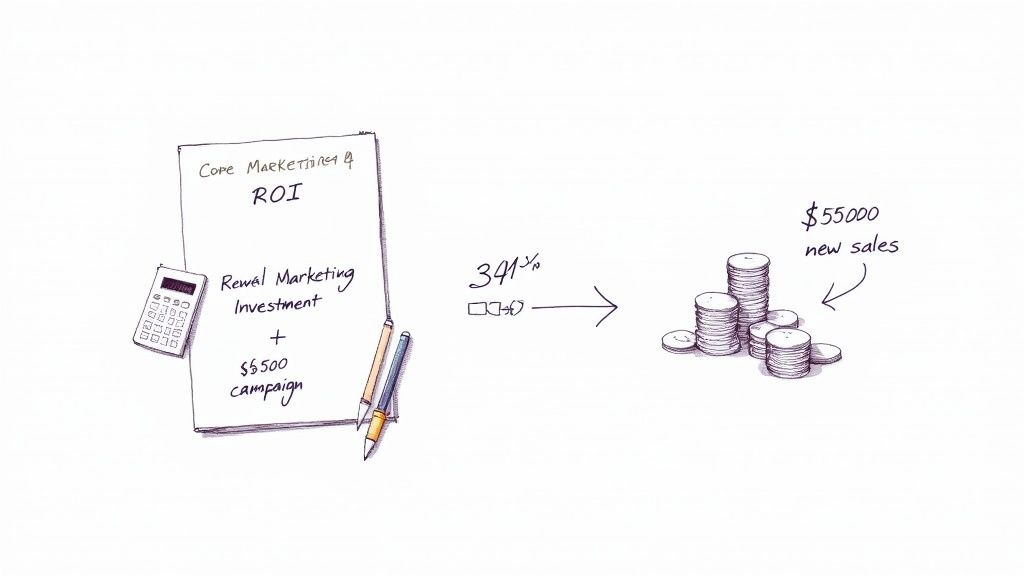
When you boil it all down, proving your marketing's worth often comes back to one simple question: did we make more money than we spent? The classic formula to answer this is (Sales Growth - Marketing Investment) / Marketing Investment. It’s the starting point for turning your marketing efforts from a cost center into a clear, provable business driver.
Calculating Your Core Marketing ROI
Before you get lost in complex attribution models and dozens of vanity metrics, you have to nail the fundamental ROI calculation. This is your bedrock. It's how you move the conversation from "we got a lot of clicks" to "we drove real revenue."
The beauty of this core formula is its straightforwardness. It cuts through the noise and answers the one question your CEO and CFO really care about: "Was our marketing spend worth it?"
Breaking Down the Formula Components
To get a number you can actually trust, you need to be crystal clear on what each part of that formula means. This is where so many marketers trip up—a small misinterpretation here can throw your entire calculation off and lead you to make some bad strategic calls.
Here’s a quick reference table breaking down the variables in the standard marketing ROI calculation.
Marketing ROI Formula Components
| Component | Description | Example |
|---|---|---|
| Sales Growth | The bump in revenue you can tie directly to a specific marketing campaign. This is your "return." | A company generates $50,000 in new sales from an email marketing campaign. |
| Marketing Investment | The total cost to run the campaign. This goes way beyond just your ad spend. | A $10,000 budget covering ad placements, content creation, and software subscriptions. |
Getting a handle on your true Marketing Investment is absolutely critical. It’s not just the line item for Google Ads or your social media boosts. You have to account for everything that went into making the campaign happen.
This means you need to track:
- Direct Costs: The obvious stuff, like ad spend, agency fees, or influencer payments.
- Creative Costs: Any money spent on graphic design, copywriting, or video production.
- Human Costs: A portion of the salaries for the team members who spent time on the campaign.
If you ignore these associated costs, you'll artificially inflate your ROI and get a false sense of victory. Real accuracy comes from a full accounting of every dollar and hour you put in.
Key Takeaway: For a precise ROI, you must include all costs, not just the obvious ones. Factoring in salaries, software, and creative development gives you a true picture of profitability and keeps you from overestimating a campaign's success.
A Real-World Calculation Example
Let's make this concrete. Imagine a B2B SaaS company runs a targeted LinkedIn ad campaign to bring in new leads.
Their total Marketing Investment looks like this:
- Ad Spend on LinkedIn: $4,000
- Content & Creative (eBooks, ad visuals): $1,500
- Marketing Team Salaries (allocated hours): $1,000
- Total Investment: $6,500
Over the next quarter, the sales team can directly attribute $25,000 in new recurring revenue to the leads that came from this specific campaign. Now we've got the numbers we need.
The standard formula is ([Sales Growth – Marketing Investment] / Marketing Investment) × 100.
Plugging in our numbers, we get ([$25,000 – $6,500] / $6,500) × 100, which gives us a 284% ROI.
What does that actually mean? For every dollar they put into that campaign, they got $2.84 back in profit.
Globally, a 5:1 revenue-to-spend ratio (which is a 400% ROI) is often seen as a great benchmark, but performance can vary wildly between channels.
This single number changes everything. Your report is no longer just a list of things you did; it's a powerful business case for future investment. It's how you go into a budget meeting with confidence. To get even more practical, it's worth learning how to measure marketing ROI in your tech stack to automate some of this. And if you're looking for ways to feed this engine, our guide on how to generate B2B leads provides some solid strategies.
Getting Your Data Ready for an Accurate ROI Calculation
Any ROI calculation is only as good as the data you feed it. This is the unglamorous but absolutely critical step where you move from theory to reality, making sure your final number isn't just a shot in the dark. Think of it as mise en place for a chef—get the prep work wrong, and the entire dish is a bust.
You'll need to start by pulling numbers from different corners of your business. Your sales figures are probably living in a CRM like Salesforce, while your marketing costs are likely scattered across ad platforms like Google Ads and your company's accounting software. The real challenge isn't just finding the data; it's getting it all to speak the same language.
Creating a Single Source of Truth
Your first job is to get all this information into one place. A simple spreadsheet can work wonders here, acting as your command center for the entire ROI analysis. The whole point is to avoid the classic “garbage in, garbage out” problem, where messy inputs give you meaningless results.
To get clean, usable data, you'll need to standardize a few key things:
- Consistent Timeframes: Make sure every data source covers the exact same period. If your sales data is for Q1 (Jan 1 - Mar 31), your marketing cost data has to match perfectly. A mismatch of even a few days can throw off your entire calculation.
- Uniform Currencies: If you operate internationally, convert all financial figures to a single currency. Use a consistent exchange rate for the period you're looking at to keep market fluctuations from distorting your ROI.
- Clear Cost Categories: Break down your marketing investment into logical buckets. It’s important to separate direct costs (like ad spend) from indirect costs (like a portion of your team's salaries or software subscriptions).
This meticulous alignment is what stops you from comparing apples to oranges. It’s the difference between a vague estimate and a number you can confidently take to your leadership team.
Identifying and Filtering Out the Noise
Once your data is organized, the next step is to look for confounding variables. These are outside factors that can mess with your sales numbers but have nothing to do with your marketing campaign. If you ignore them, a campaign can look way more or less successful than it actually was.
Pro Tip: A sudden spike in sales feels great, but always ask why it happened. Was it really your campaign, or was it a surprise shoutout from a major industry influencer? Isolating your marketing's true impact is the secret to an honest ROI calculation.
Let's say you launch a new ad campaign in May. That same month, your company gets a glowing review in a major trade publication, which sends a wave of traffic and sales your way. If you credit all of that growth to your ad campaign, your ROI will be artificially inflated.
Here’s a quick-and-dirty process for spotting and managing these variables:
- Track External Events: Keep a simple log of big industry events, PR mentions, or competitor moves that happened during your campaign.
- Analyze Organic Traffic: A sudden, massive jump in direct or referral traffic is a big clue. Dig into your analytics to find the source. If you need a hand, our guide on how to increase website traffic organically can point you in the right direction.
- Establish a Baseline: What was your average monthly sales growth before the campaign? Subtracting this baseline from the growth you saw during the campaign helps isolate the actual lift your marketing efforts provided.
By systematically cleaning your data and accounting for outside influences, you’re not just running a report; you’re building a repeatable process for generating trustworthy insights. This discipline is what turns your ROI calculation from a one-off task into a strategic tool for making smarter marketing decisions.
Choosing the Right Attribution Model for Your Business
So, how do you give credit where credit is due? That's the core question of marketing attribution. It’s all about figuring out which marketing touchpoints actually led a customer to convert. Think of it as mapping the customer's journey from "who are you?" to "take my money!" The model you land on will directly shape your marketing ROI calculations, telling you which campaigns are the real heroes and which are just taking up space in your budget.
Picking the right model is a pretty big deal. If you only credit the very last ad a customer clicked, you might accidentally slash the budget for the brilliant blog post that first put your brand on their radar. This one decision fundamentally changes how you see your own growth drivers.
This infographic lays out a simple decision-making process to help you figure out if your data is even ready for a proper attribution and ROI analysis.
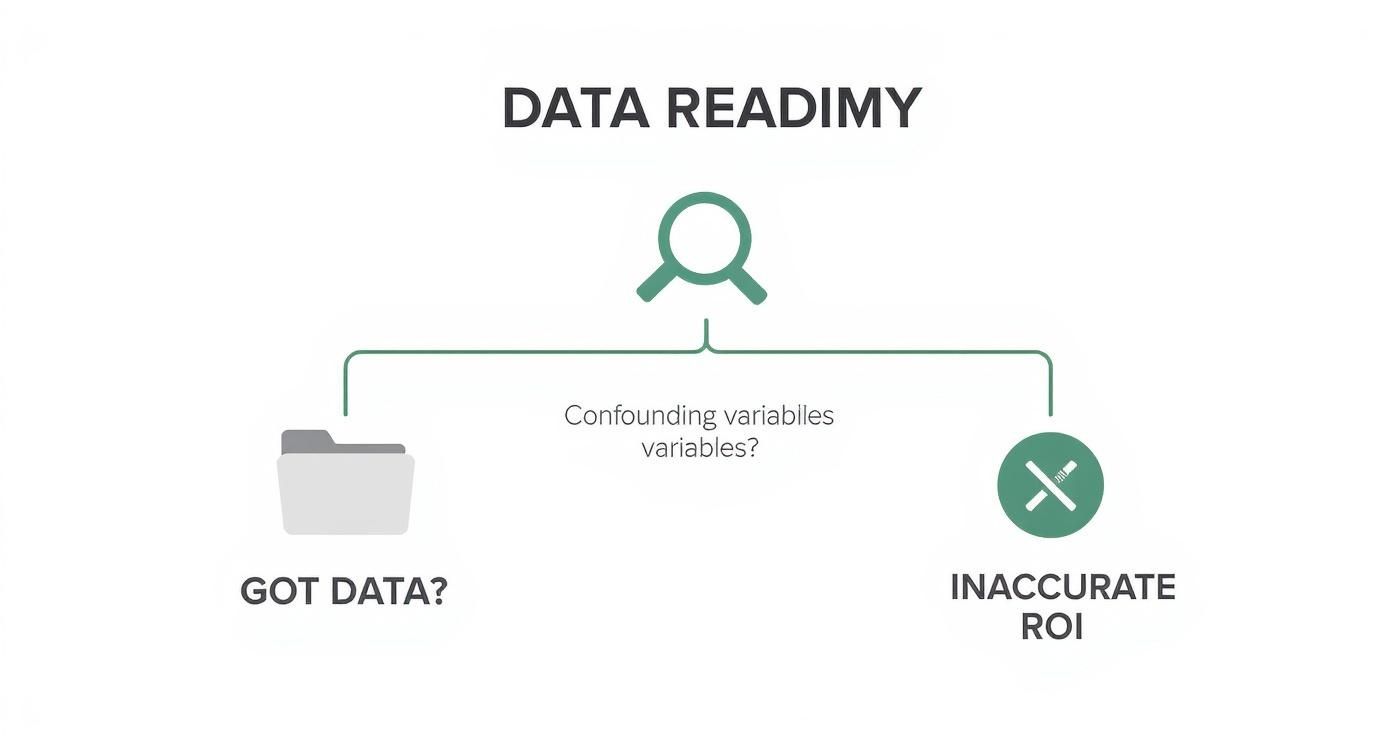
As you can see, just having the data isn't enough. You have to be smart about external factors and variables that could throw off your results.
Simple but Flawed: Single-Touch Models
Most businesses dip their toes into attribution with single-touch models. They're straightforward and easy to set up, but they have one major flaw: they give 100% of the credit for a sale to a single marketing interaction. It's a tidy but dangerously oversimplified view of how people actually buy things.
There are two main flavors here:
First-Touch Attribution: This one gives all the glory to the very first interaction someone had with your brand. It’s great for pinpointing which channels are killing it at generating top-of-funnel awareness. For example, if someone first finds you through a LinkedIn post and eventually becomes a customer, that LinkedIn post gets all the credit.
Last-Touch Attribution: This is the opposite. It gives 100% of the credit to the final touchpoint right before the conversion. This model highlights what’s effective at sealing the deal. If a customer clicks a Google Ad and immediately buys, that ad is crowned the winner, regardless of the 10 blog posts they read beforehand.
The problem? Both models wear blinders. A typical B2B sales cycle can involve dozens of touchpoints over months. Single-touch attribution completely ignores the hard work of mid-funnel content like webinars, case studies, or email nurture sequences, which can lead to some seriously misguided budget cuts.
Seeing the Whole Story with Multi-Touch Models
Multi-touch attribution models operate on a simple truth: modern customer journeys are messy and non-linear. Instead of giving all the credit to one interaction, these models spread it across multiple touchpoints, giving you a far more realistic and balanced picture of what's actually driving sales.
Setting them up is more involved, for sure, but the insights they produce for your marketing ROI calculations are exponentially better. You start to see how different channels play together—how an awareness campaign on social media tees up a lead for your sales-focused email sequence.
Key Insight: Moving from single-touch to multi-touch is like going from a black-and-white photo to a full-color 4K video. One shows you a moment in time; the other gives you the entire story with all the context you need to make smart decisions.
A Quick Tour of Multi-Touch Approaches
Multi-touch isn't a single thing; it's a category of models, each with its own way of distributing credit. The best fit for you really depends on your typical sales cycle and what you're trying to achieve.
To make it clearer, here's a quick comparison of the most common models.
Comparing Common Attribution Models
This table breaks down the key differences between the attribution models we've discussed, from the simple single-touch to the more nuanced multi-touch options.
| Attribution Model | How It Works | Best For | Potential Pitfall |
|---|---|---|---|
| First-Touch | Gives 100% credit to the first marketing interaction. | Identifying top-of-funnel channels that generate initial awareness. | Ignores everything that happens after the first touch. |
| Last-Touch | Gives 100% credit to the final marketing interaction before conversion. | Understanding which channels are most effective at closing deals. | Overlooks the channels that nurtured and educated the lead. |
| Linear | Splits credit evenly across every touchpoint in the journey. | Giving equal value to all interactions; a simple starting point for multi-touch. | Treats a quick blog visit and a 1-hour demo as equally important. |
| Time-Decay | Gives more credit to touchpoints closer to the conversion time. | Businesses with shorter sales cycles where recent interactions have more impact. | Can undervalue crucial early-stage, awareness-building activities. |
| Position-Based (U-Shaped) | Gives 40% credit to the first touch, 40% to the last, and 20% to the middle. | Valuing both lead generation and conversion-driving touchpoints highly. | Can devalue the critical mid-funnel nurturing stage. |
Ultimately, the goal is to find a model that best mirrors how your customers actually behave.
Choosing an attribution model isn't a set-it-and-forget-it task. The smartest marketers test different approaches to see which one aligns most closely with their customers' buying habits. When your model reflects reality, your marketing ROI calculations will finally be based on a true understanding of what works, not just a convenient oversimplification.
Moving Beyond Basic ROI with Advanced Metrics

While the standard marketing ROI formula gives you a solid number to report, it’s really just a snapshot in time. It tells you what happened, but it doesn't always tell you what matters for the future. To shift the conversation from a single campaign's performance to long-term business value, you need to start layering in more sophisticated metrics.
This is where you move from being a good marketer to a great one. You start answering not just "Did this campaign make money?" but "Did this campaign bring in the right kind of customers for sustainable growth?" The answer lies in looking at customer value over their entire relationship with your business.
Unlocking Long-Term Value with LTV and CAC
The two most powerful metrics for this long-term view are Customer Lifetime Value (LTV) and Customer Acquisition Cost (CAC). When you look at them together, they paint a far more complete picture of your marketing's true impact and profitability.
- Customer Acquisition Cost (CAC): This is the total cost of your sales and marketing efforts to acquire a single new customer. The calculation is straightforward:
Total Sales & Marketing Spend / Number of New Customers Acquired. - Customer Lifetime Value (LTV): This metric predicts the total revenue you can reasonably expect from a single customer throughout their entire relationship with your business.
Suddenly, a campaign with a lower initial ROI might actually be your most valuable one. Imagine you run two campaigns. Campaign A has a 400% ROI but brings in one-off customers. Campaign B only has a 200% ROI but attracts subscribers who stick around for years. Which one is truly better for the business? LTV and CAC help you answer that question with data, not just gut feelings.
The Gold Standard: The LTV to CAC Ratio
The real magic happens when you put these two metrics head-to-head. The LTV:CAC ratio is the ultimate health check for your marketing engine's sustainability.
A ratio of 1:1 means you’re just breaking even on each new customer, which is a dangerous place to be. You’re essentially spending every dollar of future revenue just to get them in the door.
Industry benchmarks often point to a 3:1 ratio as the gold standard for a healthy, scalable business. This means for every dollar you spend to acquire a customer, you can expect to get three dollars back in lifetime value. A ratio higher than 3:1, like 4:1, signals very strong long-term profitability and an efficient growth model. As you can discover in this detailed guide to marketing ROI, this is especially crucial for businesses with long sales cycles, like SaaS or B2B enterprise companies.
Key Takeaway: A campaign that attracts high-LTV customers can be a huge win even with a modest initial ROI. Focusing on the LTV:CAC ratio shifts your strategy from short-term gains to building a foundation for profitable, long-term growth.
Isolating True Impact with Incremental Lift
Another powerful way to look at ROI is by measuring incremental lift. This method moves beyond attribution entirely and focuses on a simple question: What happened that wouldn't have happened without this specific marketing activity?
It’s the best way I’ve found to prove causation, not just correlation. The most common way to measure this is through controlled experiments, like A/B tests or geo-split tests.
Here’s a real-world scenario. An e-commerce company wants to know if a new retargeting ad campaign is actually driving sales or just getting credit for sales that would have happened anyway.
- They create a test group: This group of users sees the new retargeting ads.
- They create a control group: This group is intentionally held back and does not see the ads.
- They compare the results: After a set period, they measure the total revenue from both groups.
Let's say the test group generated $75,000 in sales, while the control group generated $50,000. The campaign cost $10,000. The incremental lift is the difference between the two groups: $25,000.
Now, you calculate ROI based on that lift: ([$25,000 - $10,000] / $10,000) x 100 = 150% ROI.
This 150% is the true return, stripped of any conversions that would have occurred organically. This kind of analysis is invaluable for optimizing your budget and cutting spend that isn’t genuinely driving new business. Similarly, understanding your market presence is key; you can learn more about how to calculate your share of voice to complement these ROI metrics.
How to Interpret Your Results and Avoid Common Pitfalls
You’ve run the numbers, triple-checked the data, and now you have an ROI figure staring back at you. This is where the real work actually begins—turning that number into a smart, actionable strategy. An ROI calculation on its own is just data; it's the interpretation that makes it meaningful.
Knowing your ROI is 300% doesn't automatically tell you whether to pop the champagne or head back to the drawing board. The critical next step is to put that result into context by benchmarking it. Is 300% fantastic, average, or lagging for that specific channel and your industry?
Setting the Right Benchmarks
Here's the thing: a "good" ROI is completely relative. A 230% return from a social media campaign might be a huge win, especially if its main job was building top-of-funnel awareness. But that same 230% on a high-intent, bottom-of-funnel paid search campaign? That could be a major red flag signaling a serious inefficiency.
To get the full picture, you need to compare your results against a few key benchmarks:
- Your Own Past Performance: This is your most valuable benchmark, hands down. Is this campaign outperforming your last one? The real goal is consistent, steady improvement over time.
- Channel-to-Channel Averages: How does your email marketing ROI stack up against paid search? Comparing channels helps you see where you should double down and where you might need to optimize or pull back.
- Industry Averages: While these can be broad, they give you a general sense of what’s possible. Knowing the industry standard helps you manage expectations and set more realistic targets for your team.
Understanding these benchmarks is what transforms your ROI from a static number into a dynamic tool for making strategic decisions.
Key Takeaway: An ROI figure is only useful in context. You have to compare it against your past performance, other channels, and industry standards to understand what the number truly means for your business.
Recent data really drives home how much these benchmarks can vary. A deep dive into digital marketing campaigns, for example, found that while social media averaged an ROI around 230%, some paid search campaigns in certain sectors blew past 400%. It just goes to show that a "great" return depends heavily on the channel you choose and the dynamics of your market. You can explore more detailed digital marketing ROI statistics on First Page Sage to see how different channels stack up.
Common Pitfalls and Traps to Avoid
Calculating marketing ROI is like navigating a minefield of potential errors. Even with clean data and a solid formula, it's surprisingly easy to fall into common traps that can completely distort your results and lead to some seriously bad decisions.
Knowing what these pitfalls are is the first step toward building a measurement process you can actually trust. Here are a few of the most frequent mistakes I see marketers make—and how to sidestep them.
1. Misattributing Organic Growth
This is probably the most common error of them all. A business naturally grows over time thanks to brand recognition, word-of-mouth, and general market trends. If you launch a campaign and credit 100% of the sales lift that follows to that one campaign, you’re definitely overstating its impact.
How to avoid it: You always need to establish a baseline. Before you even start, calculate your average monthly or quarterly growth. Then, subtract this organic baseline from the total growth you saw during the campaign to isolate the true incremental lift.
2. Ignoring All the Costs
So many marketers only count the most obvious expense: ad spend. They completely forget the "hidden" costs that are just as real, like the salaries of team members who worked on the campaign, software subscription fees, or the cost of producing the creative assets.
How to avoid it: Get meticulous with your accounting. Create a checklist of every possible marketing expense—both direct and indirect—and track them for every single campaign. This is the only way to get a true picture of your total investment and a more honest ROI figure.
3. Using the Wrong Timeframe
Measuring ROI too soon is a classic mistake, and it's especially dangerous for businesses with longer sales cycles. If your typical B2B sales process takes three months from lead to close, calculating your ROI after just 30 days will completely miss the mark. Most of your leads haven't even had time to convert yet.
How to avoid it: Make sure your measurement window aligns with your average sales cycle. For long-haul strategies like SEO or content marketing, it makes far more sense to measure ROI on a quarterly or even semi-annual basis. You have to give those efforts enough time to mature and actually generate revenue.
By sidestepping these common pitfalls, you build credibility in your reporting and ensure that your ROI calculations are a reliable foundation for your marketing strategy. This disciplined approach is how you turn raw data into genuine business intelligence that actually drives growth.
Your Top Marketing ROI Questions, Answered
Even with the right formulas and clean data, you're bound to run into some tricky questions once you start digging into your marketing ROI. Let's tackle a few of the most common ones that pop up in the real world. Think of this as the practical advice you need for those "what about..." moments.
Getting these details right is what turns a simple calculation into a powerful tool that actually guides your strategy.
How Often Should I Be Calculating Marketing ROI?
Honestly, there’s no magic number here. The right frequency really depends on your sales cycle and the kinds of campaigns you're running. A one-size-fits-all approach just doesn't work.
If you’re in a fast-paced business like e-commerce or running short-term ad campaigns, you should probably be checking in weekly or bi-weekly. This lets you make quick adjustments and shift your budget to what’s working right now.
On the other hand, for long-haul strategies like SEO or content marketing, a monthly or quarterly review makes a lot more sense. These channels take time to gain traction. Looking at them quarterly gives your efforts enough room to breathe and provides a more stable, less frantic view of performance. This is especially true for B2B companies with longer sales cycles.
My Takeaway: Line up your ROI reporting with your sales cycle. If you try to measure a six-month sales cycle on a weekly basis, you're just setting yourself up for frustration and bad decisions. Give your strategies time to work before you pass judgment.
What’s Actually a Good Marketing ROI?
This is the big one, isn't it? The classic answer is, "it depends." And it's true—what's good varies wildly depending on your industry, profit margins, and business model. But if you're looking for a general benchmark, a 5:1 revenue-to-spend ratio is a great target. That works out to a 400% ROI, meaning for every dollar you put in, you get five dollars back.
Here's a rough guide to help you contextualize your numbers:
- 2:1 (100% ROI): This is often just breaking even once you account for the cost of your products and other business expenses.
- 5:1 (400% ROI): A very healthy return. This signals that your marketing is running efficiently.
- 10:1 (900% ROI): Absolutely stellar. This kind of return is tough to maintain but shows a campaign is firing on all cylinders.
At the end of the day, the most important goal is to beat your own past performance. Continuous improvement is a much better sign of success than chasing some universal, and often arbitrary, number.
How Do I Measure ROI for Brand Awareness Campaigns?
Ah, brand awareness. It's notoriously difficult because you can't just draw a straight line from a billboard or a social media post to a sale. The whole point isn't an immediate conversion; it's about building recognition and trust over the long term.
The trick is to use proxy metrics instead of direct revenue. You'll want to track the growth of key indicators that show your brand's footprint is expanding:
- Growth in branded search terms (people Googling your company name).
- An increase in direct traffic to your website.
- Better social media engagement and a growing follower count.
From there, you have to assign a value to these actions based on your own historical data. For example, if you know that one out of every 100 people who sign up for your webinar eventually becomes a $5,000 customer, then you can say each sign-up is worth about $50. This gives you a tangible number to work with, allowing you to calculate a proxy ROI and prove the value of your brand-building efforts.
Here at Replymer, we're all about turning genuine conversations into measurable results. Instead of just hoping your social outreach is working, our service gives you a clear view of every mention, reply, and inbound lead you generate from real, human-written interactions on Reddit, X, and LinkedIn. See how you can prove the ROI of authentic engagement with Replymer.


