
When you're fighting for every customer, you need to know how much of the conversation your brand actually owns. That’s where Share of Voice (SOV) comes in. For a growing startup, this isn't some fluffy vanity metric—it’s a cold, hard leading indicator of future market share and a vital sign of your brand's health.
It answers a simple but critical question: when people in your market talk, how often are they talking about you?
What Share of Voice Really Means for Your Startup
It’s a common mistake to think SOV is just about who spends the most on ads. That might have been true back in the day, but the game has changed completely. Today, a true measure of SOV looks at your brand’s visibility across everywhere your customers are looking for answers. It's a holistic view of your presence, from organic search and social chatter to PR mentions and paid campaigns.
This wider perspective is what gives you the full story of your influence. For a deeper dive into the fundamentals, this piece on What Is Share of Voice and How to Win It is a great starting point.
Moving Beyond Simple Mentions
Thinking beyond ad spend gives you a much richer, more actionable picture. A modern approach to SOV pulls in data from a whole spectrum of channels. We're talking about organic traffic, how often you're mentioned on social media, your website's engagement—all of it. This shift is well-documented on platforms like HubSpot's marketing blog, reflecting its new role as a core brand visibility metric.
For a growth team, this more complete view of SOV lets you:
- Spot Competitive Gaps: You can see exactly where rivals are winning the conversation and, more importantly, where they're dropping the ball. Is their SEO game on point but their social presence is a ghost town? That's your opening.
- Sharpen Your Marketing Strategy: The data doesn't lie. It tells you which channels are delivering and which are draining your budget. A huge SOV in earned media, for instance, is a strong signal that your PR and content efforts are resonating and deserve more investment.
- Connect Your Work to Revenue: A rising Share of Voice almost always precedes a jump in market share. By tracking this link, you can finally draw a straight line from your brand-building activities to the bottom line and prove your ROI.
The rule of thumb is powerful: if your share of voice is greater than your share of the market, you're set up for growth. If it's lower, you’re on track to lose ground. It's one of the most reliable predictive tools in a startup's arsenal.
Share of Voice vs. Market Share
It's crucial not to confuse Share of Voice (SOV) with Share of Market (SOM). They're connected, but they measure two very different things.
Share of Voice (SOV) is a marketing metric. It’s all about awareness and conversation, measuring your brand’s visibility against the competition.
Share of Market (SOM) is a sales metric. It’s purely about revenue, measuring your total sales as a percentage of all sales in your industry.
Think of it like this: SOV is the input, and SOM is the output. By getting louder and dominating more of the conversation (increasing SOV), you create the momentum needed to capture more customers and revenue (increasing SOM). Once you grasp that relationship, you can start using SOV as a strategic lever for real growth.
Getting the Right Data for Your SOV Calculation
Before you even think about plugging numbers into a formula, let's be clear: your Share of Voice calculation is only as good as the data you feed it. Garbage in, garbage out. If you pull incomplete or sloppy metrics, you'll end up with a skewed view of where you stand, making your final SOV number basically useless.
The real goal here is to build a smart, repeatable process for collecting the right information from the right places. We're not just grabbing numbers for the sake of it; we're strategically choosing metrics that give us a true picture of our brand's visibility across the channels that actually move the needle.
First, Know Who You're Fighting
This part seems obvious, but it’s where a lot of teams stumble. The competitors you face in a sales demo aren't always the same ones you're battling for search rankings or social media attention. You might be up against a massive enterprise company for big deals, but a scrappy startup could be eating your lunch on a key long-tail keyword.
Start by creating a focused list of 3-5 key competitors you want to track. These are the brands that consistently pop up in the same search results, get mentioned in the same industry articles, and show up in the same social conversations as you. Keeping the list tight makes the whole process manageable and the results far more insightful.
Finding Your Data Sources
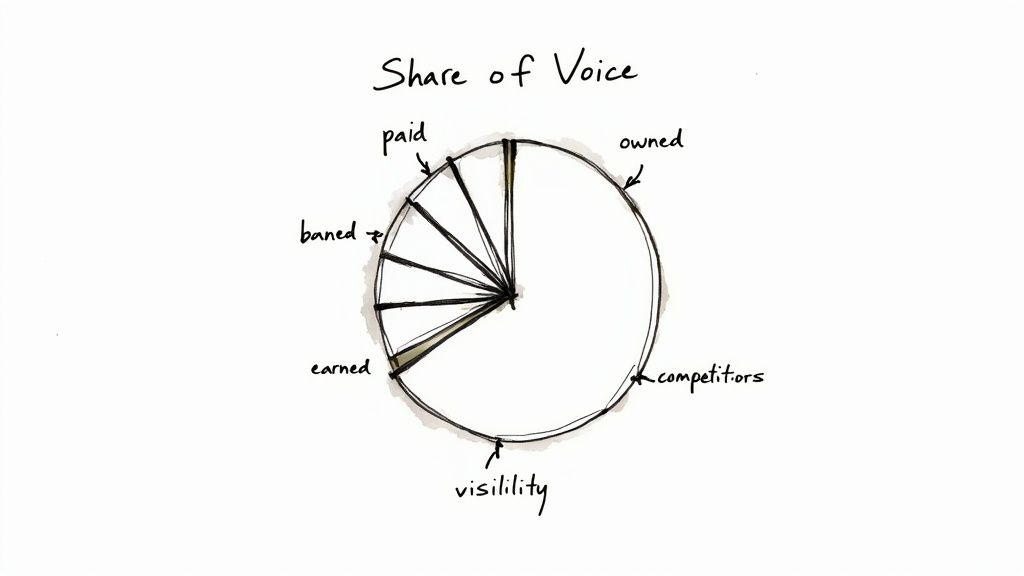
To get a complete picture, you need to pull data from three distinct areas: earned, owned, and paid media. Each one tells a different part of the story.
Here's a quick breakdown of where to look and what to track:
The table below breaks down the key metrics you'll need for each channel and the best tools for the job. Think of this as your data-gathering cheat sheet.
Essential Data Sources for Share of Voice Calculation
| Channel Type | Key Metric to Track | Recommended Tools | What It Tells You |
|---|---|---|---|
| Earned Media | Brand Mentions & Backlinks | Brand24, Meltwater, Ahrefs | How often people are organically talking about and linking to your brand. |
| Owned Media | Keyword Rankings & Visibility | SEMrush, Ahrefs, Google Search Console | How much of the organic search "real estate" you control for relevant topics. |
| Paid Media | Impression Share | Google Ads, LinkedIn Ads, etc. | What percentage of the available ad space you are capturing versus your competition. |
Having this data organized makes the calculation itself straightforward and gives you a much clearer understanding of where you're winning and where you're falling behind.
Data for Earned Media
Earned media is the organic chatter about your brand. It’s what people say when you're not paying them to say it. The two metrics that matter most here are brand mentions and backlinks.
- Brand Mentions: You need to track every time your company name, products, or even key executives are mentioned online. This could be on social media, in forums like Reddit, or in news articles and blog posts. Tools like Brand24 or Meltwater are perfect for this, letting you quantify how much conversation you're generating.
- Backlinks: Every link to your site from another website is essentially a vote of confidence. SEO tools are non-negotiable here. I live in Ahrefs to track not just how many new links we're getting, but also their quality and where they're coming from. You want to see how your backlink growth stacks up against the competition.
A quick pro-tip: not all mentions are created equal. A feature in Forbes carries a lot more weight than a random tweet. For a simple SOV calculation, you can treat them all the same, but a more advanced analysis should definitely factor in the authority and reach of the source.
Metrics for Owned Media
Owned media is all about the digital turf you control—your website, your blog, your content. The big question here is: when someone searches for a solution you provide, how visible are you?
The key things to measure are:
- Organic Keyword Rankings: How many important keywords are you ranking for, and how high up the page are you? Using a tool like SEMrush or Ahrefs, you can get a "keyword visibility" score that estimates what percentage of all possible clicks you're capturing for the keywords you care about.
- Organic and Direct Traffic: While this isn't a direct SOV metric on its own, your Google Analytics traffic data provides critical context. If your organic traffic is climbing, it's a strong signal that your share of voice in search is growing too. Our guide on how to increase website traffic organically dives deep into tactics that directly boost this.
This data tells you how much of the "search conversation" you truly own. Are you the first answer potential customers find, or is your competitor?
Tracking Paid Media Visibility
For your paid campaigns, the old-school way of measuring SOV was based on ad spend, but good luck getting your competitors to share that information. A far more practical and modern approach is to focus on Impression Share.
Thankfully, this metric is built right into platforms like Google Ads.
Impression Share tells you the percentage of time your ads were shown out of the total number of times they could have been shown. For example, an impression share of 60% means your ad appeared 6 out of every 10 times a relevant search happened. The other 40% of the time, your ad was sitting on the sidelines because of your budget or ad rank. That 40% is a golden opportunity for your competitors. It's the most direct way to measure your paid Share of Voice.
Crunching the Numbers: How to Calculate Your Share of Voice
Alright, you’ve identified your competitors and picked your tools. Now it’s time to actually get your hands dirty and calculate your Share of Voice. The core concept is wonderfully simple, but the secret is in applying it correctly to different channels—search, social, and paid.
No matter the channel, the formula at its heart is always the same:
(Your Brand's Metric / Total Market Metric) x 100 = Your Share of Voice %
This little equation is your window into how much space you're taking up in organic search, social chatter, and paid advertising.
To really nail this, you need to pull data from multiple sources. Think of it like building a complete puzzle—each channel gives you a different piece of the overall picture.
As you can see, a true SOV calculation isn't about just one number. It’s about creating a holistic view of your presence across the board.
Nailing Your Share of Search
For most SaaS companies, Share of Search is the big one. It's a direct measure of your visibility on Google for the exact terms your ideal customers are typing in. A high Share of Search means you're capturing people right when they're ready to buy.
The key metric here is often called organic visibility or keyword visibility. Tools like Ahrefs and Semrush do the heavy lifting, calculating the percentage of all possible organic clicks you're likely to get for a specific set of keywords.
Let's see this in action.
A Real-World SaaS Scenario
Imagine you run "SyncUp," a project management tool. Your main rivals are "TaskFlow," "ProjectPal," and "TeamHub." You want to figure out your Share of Search for a money keyword: "project management software for remote teams."
First, you'd use your SEO tool to pull the organic visibility score for that keyword across your competitive set.
- SyncUp (Your Brand): 25% visibility
- TaskFlow: 40% visibility
- ProjectPal: 15% visibility
- TeamHub: 10% visibility
- Other small competitors: 10% visibility
Next, you'll add those up to define the total "market" for that keyword.
- Total Market Visibility = 25% + 40% + 15% + 10% + 10% = 100%
Now, just plug your number into the SOV formula.
- (Your Visibility / Total Market Visibility) x 100
- (25% / 100%) x 100 = 25%
There it is. Your Share of Search for this crucial term is 25%. This tells a clear story: for every four potential customers looking for a solution, only one is likely even seeing your brand in the search results.
Measuring Your Share of Conversation on Social
Next, we move from search intent to social buzz. Your "Share of Conversation" tells you how much of the online chatter in your industry is actually about your brand. This is a fantastic pulse check on brand awareness, sentiment, and community engagement. The metric we care about here is brand mentions.
A B2B Social Media Example
Let's stick with SyncUp. You want to see how you stack up against competitors in conversations around "#RemoteWorkTools" on X (formerly Twitter) and LinkedIn over the last month. Using a social listening tool like Brand24, you pull the mention counts.
- SyncUp (Your Brand): 800 mentions
- TaskFlow: 1,200 mentions
- ProjectPal: 650 mentions
- TeamHub: 350 mentions
Now, find the total conversation volume.
- Total Mentions = 800 + 1,200 + 650 + 350 = 3,000 mentions
Finally, calculate your share.
- (Your Mentions / Total Market Mentions) x 100
- (800 / 3,000) x 100 = 26.7%
Your Share of Conversation is 26.7%. While TaskFlow is clearly dominating the discussion, you're making more noise than two of your main rivals put together. That's a solid insight. If you're looking for ways to push that number higher, this guide on building a B2B social media strategy is a great place to start.
A Quick Pro-Tip: Don't just track volume; track relevance. A good social listening setup filters out the noise—like people talking about "syncing up" for coffee—so you're only measuring conversations that actually matter to your business. Precision beats pure volume every time.
Gauging Your Impression Share in Paid Media
Last but not least, let's talk about paid ads. You can't see your competitors' ad spend directly, so the best proxy for paid SOV is a metric called Impression Share. It's built right into platforms like Google Ads and tells you what percentage of potential ad views you actually captured.
A Google Ads Campaign Example
SyncUp is running Google Ads targeting those same "project management software" keywords.
When you log into your Google Ads account, the platform gives you the number directly. For this campaign, your Impression Share is 45%.
That's it. No complex calculation needed. Your paid SOV is 45%. This means that for every 100 times an ad could have been shown for your target keywords, yours was shown 45 times.
But Google Ads gives you more than just the number; it tells you why you missed out on the other 55% of impressions.
- Lost IS (budget): 30% — Your ads stopped showing because you hit your daily budget too early.
- Lost IS (rank): 25% — Your ad rank, which is based on your bid and Quality Score, wasn't high enough to win the auction.
This makes paid SOV incredibly actionable. You have a crystal-clear path to increasing it: either put more money behind the campaign or work on improving your ad relevance and landing pages to boost your ad rank.
How to Interpret Your SOV Results for Growth
Getting a number from your Share of Voice calculation is actually the easy part. The real work—and where the value truly lies—starts when you translate that raw data into a story about where you stand in the market. A simple percentage is just a metric; how you read it is what builds a strategy.
Think of your SOV results as a diagnostic tool. It instantly shows you the strengths and weaknesses across your entire marketing mix. When you see the numbers side-by-side for earned, owned, and paid channels, you can immediately spot where you’re winning and where you’re getting drowned out.
Connecting the Dots Between Channels
Let's play out a common scenario. Imagine your analysis reveals a fantastic Share of Conversation on social media, but your Share of Search for core keywords is disappointingly low. This isn't a failure—it's a critical insight.
It tells you that your brand is generating real buzz and people are talking about you, but that energy isn't translating into visibility when potential customers are actively looking for a solution.
This kind of disconnect points to a clear, actionable opportunity. Your audience is obviously interested in what you have to say, but they can't find you in those high-intent search moments. The strategic move isn't just to "do more SEO." It's about bridging that gap. You need to create content that directly answers the questions your social audience is asking and then optimize it for search. This way, your social momentum starts directly fueling your efforts to capture valuable search traffic and generate high-quality inbound leads. For more on this, check out our guide on how to get inbound leads for your business.
- High Social SOV, Low Search SOV: Your brand is popular, but it's not findable. The fix? Start turning those social conversations into search-optimized content.
- High Paid SOV, Low Earned SOV: You're successfully buying attention, but you aren't earning it organically. It's time to invest in PR, content, and community building to create genuine advocacy.
- High Search SOV, Low Social SOV: Your content is functional and ranks well, but it lacks a community around it. Use your search authority to build a following and spark conversations on social platforms.
Understanding Excess Share of Voice (ESOV)
One of the most powerful concepts you can apply here is the relationship between Share of Voice and Share of Market (SOM). Decades of research have shown a surprisingly strong link between the two. When your SOV is higher than your SOM, your brand is primed for growth. When it’s lower, you're at risk of losing market share.
That gap is called Excess Share of Voice (ESOV). It's a foundational principle for setting marketing goals that are both ambitious and realistic.
The core idea is that a brand's "voice" must be louder than its current market presence to grow. By investing in awareness and conversation beyond its current size, a brand creates the conditions for future sales growth. It's the marketing equivalent of dressing for the job you want, not the job you have.
This isn't just a neat theory; it's backed by a ton of data. Landmark research has found that brands typically increase their market share by about 0.5% for every extra 10% of excess share of voice they achieve. Discover more insights about these findings from Nielsen.
This gives you a powerful, data-backed benchmark. If your startup currently has a 2% market share, aiming for a 12% Share of Voice (that’s 10% ESOV) is a concrete strategy for targeting a future market share of 2.5%.
From Data to Actionable Decisions
Armed with these insights, you can finally move from just reporting numbers to making sharp, data-driven decisions that actually push your startup forward. Your SOV report becomes less of a report card and more of a strategic map, guiding how you spend your time and money.
Here are a few ways this can play out in the real world:
- Allocate Your Budget Smarter: If a competitor is absolutely dominating paid search (they have a massive Impression Share), trying to outspend them is probably a losing battle. Instead, you might reallocate that budget to boost your organic content or social presence where there's less noise and more opportunity.
- Refine Your Messaging: Don't just look at how much competitors are mentioned; look at what is being said. What topics are they owning? What customer pain points are they hitting on? Use that intel to find a unique angle and carve out a conversational niche you can dominate.
- Set Realistic Growth Targets: Use the ESOV principle to set clear, quantifiable goals. Ditch vague objectives like "increase brand awareness" and replace them with a specific target like, "Achieve a 5% Excess Share of Voice in Q3 to support our sales target."
Ultimately, knowing how to calculate Share of Voice is just the starting line. The real competitive advantage comes from interpreting what those numbers are telling you and using them to build a smarter, more responsive growth engine for your brand.
Building Your SOV Tracking Dashboard
Let's be honest, manually crunching numbers in a spreadsheet every month is a fast track to burnout. More importantly, it means you're always looking in the rearview mirror. The real magic of Share of Voice happens when you can see it evolving in near real-time. This is why a dedicated, automated dashboard isn't just a "nice-to-have"—it's a command center for any serious growth team.
A live dashboard turns SOV from a static report into a dynamic feedback loop. You can spot trends as they’re forming, see how a competitor’s new campaign is landing, and actually measure the ripple effects of your own marketing—all without getting lost in CSV files for hours.
Choosing Your Dashboarding Tool
You don’t need to break the bank on some massive, enterprise-level platform to get this done. For most startups, the best tools are the ones that are powerful but don’t require a data science degree to operate.
- Looker Studio (formerly Google Data Studio): This is the go-to starting point for a reason. It's free, plays nicely with Google Analytics and Search Console right out of the box, and has a huge community building connectors for almost any other tool you can think of.
- Tableau or Power BI: If you already have a data-savvy person on the team or plan to weave SOV into bigger business metrics, these are fantastic next-level options. They offer more muscle for complex data blending and visualization.
The real key here is to pick one platform and commit to it. You want a single source of truth for your brand's visibility, not several competing charts.
Connecting Your Data Sources
An effective dashboard is a hub, pulling all your disparate data streams into one coherent picture. Think of it like setting up plumbing—you're creating pipelines that feed raw numbers from your various channels directly into your dashboard.
You'll do this by setting up data connectors for each source. Some are native, but for others, you might need a third-party tool like Supermetrics to act as the bridge.
Here are the essential streams you'll want to pipe in:
- SEO Data: Hook up Google Search Console for your impression and click data. To get the competitor view, you’ll need an API connection to a tool like Ahrefs or SEMrush to pull in their keyword visibility metrics.
- Social Listening Data: Tools like Brand24 usually have an API or direct connector, letting you feed mention volume and sentiment right into your dashboard.
- Paid Media Data: This is often the easiest connection to make. Platforms like Google Ads and LinkedIn Ads have direct connectors for Looker Studio, making it simple to pull in your Impression Share automatically.
- Website Analytics: Your Google Analytics connection is what ties it all together. It provides the crucial context, showing you how a rise or fall in SOV actually impacts organic, direct, and referral traffic.
I see this all the time: teams try to boil the ocean and track everything from day one. Don't. Start with one channel—get your Share of Search working perfectly. Then, layer in social. Then add paid. This iterative approach is way more manageable and far less likely to stall out.
Designing an Actionable Dashboard
A dashboard that’s just a wall of numbers is useless. It needs to tell you a story in a single glance. If you’re looking for some layout ideas, check out these excellent business intelligence dashboard examples for inspiration.
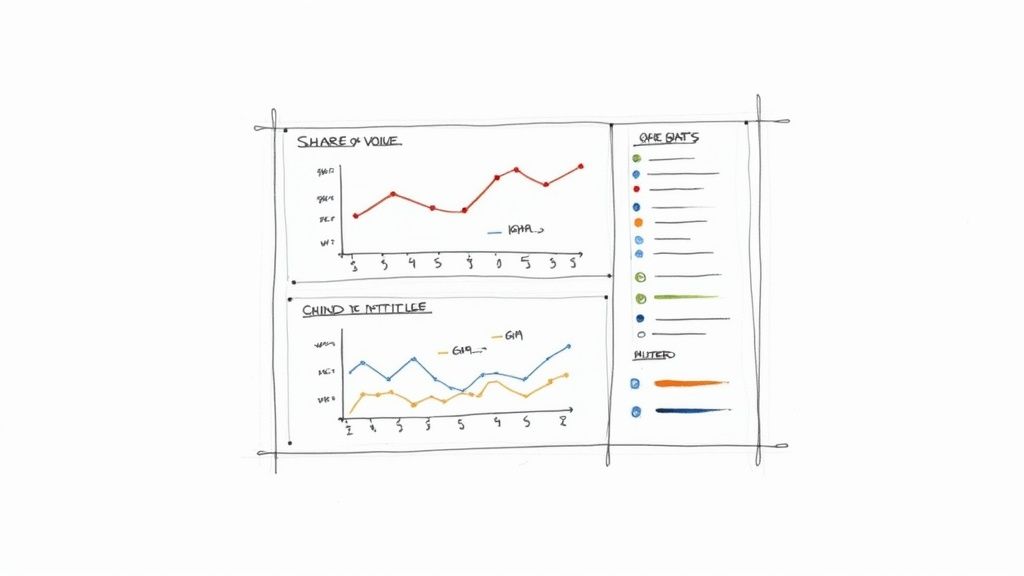
A truly well-designed SOV dashboard should have a few non-negotiable components:
- Top-Level SOV Scorecard: Big, bold numbers right at the top showing your overall SOV vs. your key competitors for the current period.
- Channel-Specific Breakdowns: Separate sections for Search, Social, and Paid SOV, each with its own trendline so you can see where you’re winning or losing.
- Historical Trend Charts: This is where the insights live. Use simple line graphs to map your SOV (and your competitors') over the last 6 to 12 months. Patterns will jump out at you.
- Competitor Quick View: A simple table showing the current SOV for each of your top three to five rivals.
By automating the data collection, you free up your team to do the work that actually matters: figuring out why the numbers are changing and what you’re going to do about it.
Got Questions About Share of Voice? We've Got Answers.
Once you get the hang of the basic formulas, the real questions start to pop up. How often should you even be checking this stuff? What's a "good" number to aim for? Don't worry, these are the exact same questions every growth team asks.
Think of this as the practical field guide to using SOV. We'll get straight to the point on timing, benchmarks, and how to work with the data you can actually get your hands on.
How Often Should We Be Measuring This?
For most startups, a monthly check-in is the right rhythm. It’s frequent enough to see how your campaigns are landing and to spot what competitors are up to, but not so often that you're drowning in data noise. Daily blips rarely tell you anything useful.
Of course, there are exceptions. If you're in the middle of a huge product launch, a major marketing campaign, or a competitor just dropped a bomb on the market, you'll want to switch to weekly tracking. That's when you need to be nimble and react fast.
What's a Good Share of Voice to Aim For?
This is the classic "it depends" question, but I can give you a better answer than that. There's no magic number that works for everyone. A "good" SOV is entirely relative to your market and your goals.
The real goal is to achieve a Share of Voice that's higher than your actual market share. This is what experts call Excess Share of Voice (ESOV), and it's one of the most reliable predictors of future growth. If your voice is bigger than your current slice of the pie, you're on the right track to grow.
For a startup just getting started, a great initial target is 5-10% SOV, but here's the key: do it within a tightly defined niche. Don't try to out-shout the giants in a broad category. Own a specific conversation first.
Can I Actually Do This With Free Tools? My Budget is Zero.
Yes, you absolutely can. It's a bit more of a manual grind, but you can get a solid directional read on your SOV without spending a dime.
Here's a scrappy but effective toolkit you can build for free:
- For Share of Search: Use Google Search Console for your organic impressions and Google Trends to see how your brand's search interest stacks up against competitors.
- For Share of Conversation: This one is manual. You'll need to actively track brand mentions and key hashtags on platforms like X (formerly Twitter) and LinkedIn where your audience hangs out.
- For Share of Media: Set up Google Alerts for your brand name and your top competitors. It's a simple way to monitor who's getting mentioned in the news and on blogs.
This DIY approach won't be perfect, but it gives you a crucial baseline to start making smarter decisions.
How Do I Figure Out What Competitors Spend on Ads? They Don't Publish That.
You're right, they don't. And trying to guess their ad spend is a fool's errand. That's why the modern way to calculate paid SOV has shifted away from budgets and toward a metric you can measure: Impression Share.
Instead of asking "who spent more?" the smarter question is "who was seen more?"
You can get this data. Platforms like SEMrush provide surprisingly accurate estimates of a competitor's paid search traffic, the keywords they bid on, and their overall ad visibility. You can then take the Impression Share data directly from your own Google Ads account and compare it to those estimates. This gives you a powerful proxy for your paid Share of Voice without ever needing to see their budget.
Ready to increase your Share of Voice where it matters most? Replymer uses human-written social replies to recommend your product in the right conversations on Reddit, X, and LinkedIn, turning everyday discussions into compounding demand. Grow your brand with authentic dialogue at https://replymer.com.


