To really get a handle on your marketing effectiveness, you have to look past the flashy numbers. Things like likes and shares feel good, but they don't pay the bills. The real goal is to connect your campaigns directly to business outcomes—think revenue and customer lifetime value (CLV). This is even more critical now, as things like cookie deprecation are forcing us all to get smarter about how we track results.
Moving Beyond Vanity Metrics to Meaningful Measurement
For a long time, marketing success was all about engagement. We chased high follower counts, thousands of likes, and viral shares because they felt like wins. And while those numbers can give you a quick pulse check on brand awareness, they rarely show what’s actually working. They're what we call vanity metrics—easy to measure and great for a slide deck, but often completely disconnected from actual business growth.
The challenge today is to start thinking like a business owner, not just a marketer. You need to be able to translate every campaign, every click, and every comment into its impact on the bottom line. Are those social media impressions actually turning into qualified leads? Is that blog post you spent weeks on shortening the sales cycle? Answering these questions means changing how you look at your data.
The Problem with Vanity Metrics
Vanity metrics can be seriously misleading. A post that gets 10,000 likes but generates zero sales is a failure compared to a targeted ad that reaches 100 people and brings in 10 new paying customers. When you rely only on that surface-level data, you create a massive blind spot. It becomes impossible to justify your budget or prove your team's value when the C-suite comes asking questions.
True marketing measurement isn’t about proving you’re busy; it’s about proving you’re effective. It’s the difference between reporting on activity and reporting on impact.
This is exactly why the best teams in the business have already made the switch. Recent research shows that a staggering 89% of leading marketers now use strategic metrics like gross revenue, market share, and CLV to figure out what's really driving results. This approach ties every marketing dollar directly to revenue, which lets you make much smarter, data-backed decisions. If you're curious, you can discover more insights on how marketing leaders are adapting their strategies.
Actionable KPIs vs Vanity Metrics
Getting this right starts with knowing the difference between a metric that just looks good and one that actually helps you make decisions. Actionable KPIs give you a real window into the health of the business and tell you where to go next. Vanity metrics just muddy the waters. For a more detailed look, you should check out our guide on creating a dashboard for social media analytics that cuts through the noise.
To make it crystal clear, here’s a breakdown of the two.
Vanity Metrics vs Actionable KPIs
The table below draws a sharp line between the metrics that make you feel good and the ones that actually do good for the business.
| Metric Type | Examples | What It Tells You | Business Impact |
|---|---|---|---|
| Vanity Metrics | Pageviews, social media likes, follower count, email open rates. | "People are seeing our content." | Low. Indicates surface-level engagement but doesn't correlate directly with revenue or customer acquisition. |
| Actionable KPIs | Conversion rate, customer acquisition cost (CAC), customer lifetime value (CLV), marketing ROI. | "Our marketing efforts are acquiring valuable customers profitably." | High. Directly measures financial performance and provides clear signals for optimizing spend and strategy. |
By making actionable KPIs the star of your show, you’re not just tracking numbers—you’re aligning your marketing strategy with the company's biggest goals. This doesn't just bring clarity to your work; it gives you the power to show real, measurable value from every dollar you spend. Frankly, it's the only way to prove your marketing is working in today's world.
Building Your Marketing Measurement Framework
If you want to measure marketing effectiveness properly, you need more than just a list of metrics. You need a structured framework that ties your day-to-day work directly to your biggest business goals. Think of it as a blueprint; without one, you're just collecting numbers in a vacuum, and data without context is just noise.
It all starts with setting clear, well-defined goals. The classic SMART framework is popular for a reason—it forces you to be Specific, Measurable, Achievable, Relevant, and Time-bound. A vague goal like "increase brand awareness" is practically impossible to measure. A much better, SMARTer goal is: "Increase organic search traffic to our key product pages by 15% in Q3." Now you have a clear target, a deadline, and a specific metric to watch.
To build a solid framework, it's also worth getting familiar with the core digital marketing performance metrics to boost ROI, as they form the foundation for everything you'll measure.
Aligning KPIs with Your Marketing Funnel
Once your goals are locked in, it's time to pick the right Key Performance Indicators (KPIs) to track your progress. These aren't just vanity metrics; they're the vital signs of your marketing health. The best way I've found to organize them is by aligning them with each stage of the marketing funnel.
Awareness: At the very top, you're just trying to get on people's radar. The main question here is, "Are people even seeing our stuff?"
- Impressions: The total number of times your content or ad was shown.
- Reach: How many unique people saw your content.
Consideration: Okay, they know you exist. Now you need to pique their interest and get them to engage. You should be asking, "Are people actually interacting with our brand?"
- Click-Through Rate (CTR): What percentage of people who saw your ad or link actually clicked on it?
- Engagement Rate: All the likes, comments, shares, and saves on your social content.
Conversion: This is where the magic happens and interest turns into action. The question becomes, "Are people doing the thing we want them to do?"
- Conversion Rate: The percentage of visitors who complete a goal, whether that's signing up for a trial or buying a product.
- Cost Per Acquisition (CPA): How much did it cost, on average, to get that one new customer?
This diagram really clarifies how your measurement focus should evolve from simple engagement metrics to what actually drives the business forward.
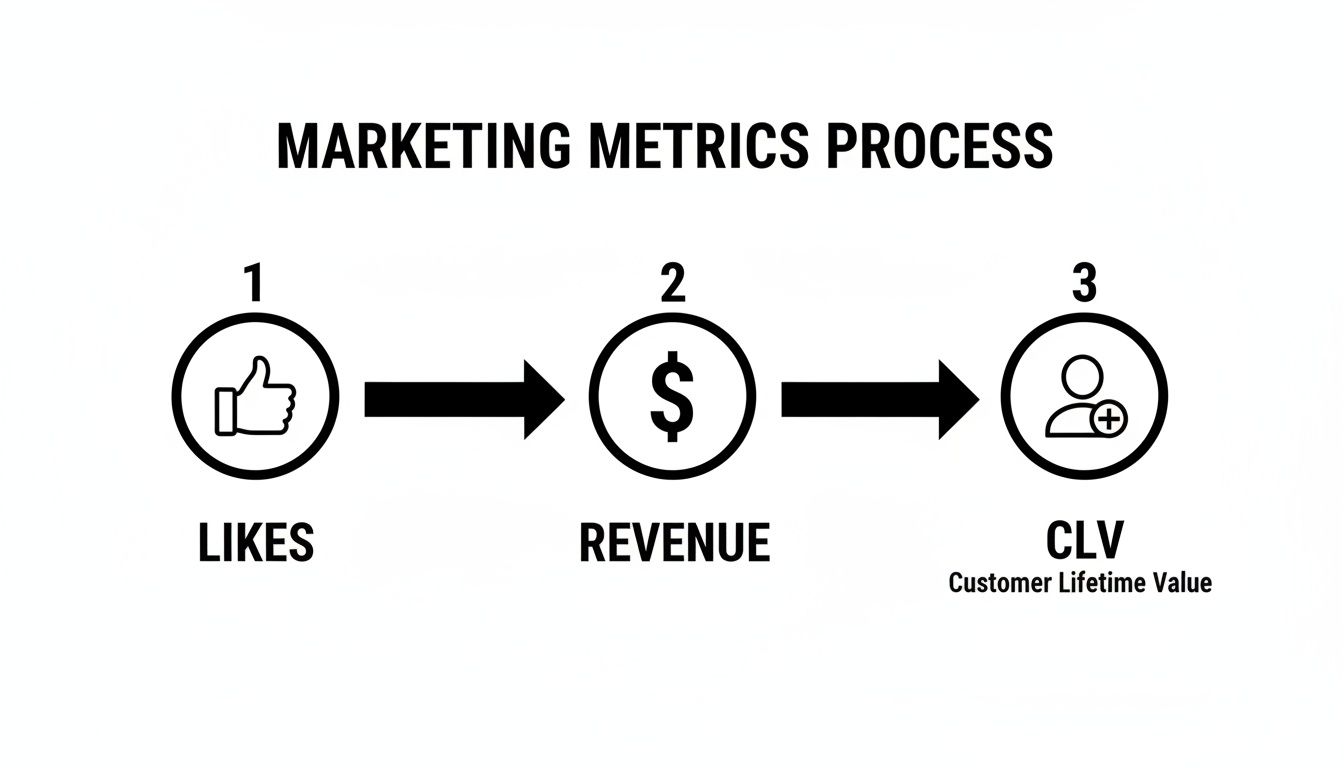
It’s a journey. You start with surface-level stats, but the real goal is to get to the metrics that reflect sustainable growth: revenue and long-term customer value.
Looking Beyond the First Conversion
A truly effective marketing measurement framework doesn't stop when you make a sale. The best SaaS and growth teams I've worked with are obsessed with post-conversion metrics. This is how they understand the real health and profitability of their customer base.
This is where things like event-based tracking come into play, especially as privacy concerns make old tracking methods obsolete. While funnel metrics are great for seeing the journey from A to B, metrics like Return on Ad Spend (ROAS) and Customer Acquisition Cost (CAC) are what really matter at the point of conversion. For example, Watches of Switzerland Group used event tracking to figure out exactly which interactions during their holiday campaigns led to a purchase. That insight allowed them to put their budget where it would have the most impact.
Two of the most critical post-conversion metrics you need to live and breathe are:
- Customer Lifetime Value (LTV): The total revenue you can reasonably expect from a single customer over the lifetime of their relationship with you.
- Customer Acquisition Cost (CAC): The total cost of marketing and sales it took to land that new customer.
The real test of a sustainable business isn't just acquiring customers; it's acquiring them profitably. This is where the LTV:CAC ratio becomes your north star.
A healthy LTV:CAC ratio is generally considered to be 3:1 or higher. This means for every dollar you spend to get a customer, you get three dollars back over their lifetime. If your ratio is too low, say 1:1, you’re basically breaking even on each customer. If it’s super high, like 5:1, you might actually be underinvesting in marketing and leaving growth on the table.
By building a framework that tracks both these crucial funnel stages and the post-conversion value, you can finally draw a straight line from your marketing efforts to real business outcomes.
Choosing the Right Attribution Models and Tools
Once you have your goals and KPIs locked in, the next big question is: which marketing touchpoints actually get the credit for a conversion? This is the world of attribution, and frankly, it's where a lot of marketing measurement plans go off the rails.
Attribution is all about connecting a customer's action—like buying a product or signing up for a trial—to the specific ads, emails, or content that influenced them along the way. Think of it like a soccer team scoring a goal. The striker gets the glory, but what about the midfielder who made the perfect pass? Or the defender who started the whole play from the back?
Assigning credit is surprisingly complex. If you get it wrong, you’ll end up pouring money into channels that feel important but don’t actually drive growth, while starving the ones that quietly do the heavy lifting. The key is to pick a model that truly reflects how your customers find and engage with you.
Unpacking Common Attribution Models
Every attribution model tells a different story about your customer’s journey. There's no single "best" option; the right choice really hinges on your sales cycle, business goals, and the channels you’re using.
To make sense of it all, let’s look at how the most common approaches stack up against each other.
Common Marketing Attribution Models Compared
This table breaks down the different ways you can assign credit, highlighting where each model shines and where its blind spots are.
| Attribution Model | How It Works | Best For | Potential Blind Spot |
|---|---|---|---|
| First-Touch | Gives 100% of the credit to the very first interaction a customer had with your brand. | Businesses focused on top-of-funnel awareness and finding new audiences. | Ignores everything that happens after discovery, undervaluing channels that nurture leads toward a decision. |
| Last-Touch | Assigns 100% of the credit to the final touchpoint before a conversion. | Short sales cycles where the final click (e.g., a "Buy Now" ad) is the most decisive action. | Completely overlooks the marketing efforts that introduced and warmed up the lead in the first place. |
| Linear | Distributes credit equally across all touchpoints in the customer's journey. | Longer sales cycles where multiple channels play a significant role in nurturing. | Treats all touchpoints as equally important, which is rarely the case. A blog post and a one-on-one demo just don't have the same impact. |
| Data-Driven | Uses machine learning to analyze conversion paths and assign credit based on actual impact. | Businesses with enough conversion data for the algorithm to learn effectively. | Can feel like a "black box" because the logic isn't transparent, and it needs a high volume of data to be accurate. |
Think about it this way: a SaaS company with a six-month sales cycle would get seriously misleading data from a Last-Touch model. It would over-credit the "Request a Demo" button but completely ignore the blog posts, webinars, and social ads that convinced the prospect to even consider a demo. A Linear or Data-Driven model would paint a much more realistic picture.
The Rise of Privacy-First Measurement
Let's be honest, traditional attribution models that rely on cookies and tracking individual users are on shaky ground. With privacy changes from Apple and Google, that kind of granular tracking is becoming less reliable by the day.
This is why a more strategic, top-down approach like Marketing Mix Modeling (MMM) is making a huge comeback. MMM uses statistical analysis to measure how different channels impact sales over time, even factoring in external things like seasonality or economic shifts. It’s less about following one person's clicks and more about understanding the big picture.
Recent data shows that over 61% of marketers are looking to beef up their strategies with faster, better MMM. If you want to get ahead of the curve, you can explore the marketing measurement trends for 2025 to see how the industry is shifting.
Marketing Mix Modeling doesn't replace attribution, but it complements it perfectly. It tells you which forests are growing, while attribution helps you identify the healthiest trees within them.
Practical Tools for Accurate Tracking
No matter which model you choose, your insights are only as good as the data you feed them. Messy tracking leads to flawed conclusions. Here's how to build a solid foundation.
Master UTM Parameters: Urchin Tracking Modules (UTMs) are just simple tags you add to your URLs. They are non-negotiable for clean data. They tell your analytics tools exactly where traffic is coming from, so you know if that click came from your newsletter, a LinkedIn ad, or a partner's website. Consistency is everything here.
Configure GA4 Conversion Events: In Google Analytics 4, everything is an "event." This means you have to explicitly tell GA4 what a "conversion" actually is for your business—whether it's a form submission, a trial sign-up, or a sale. Set these up carefully to make sure you're measuring what truly matters.
Integrate Your CRM: Your analytics platform shows you what happens before someone becomes a lead. Your CRM (like Salesforce or HubSpot) shows you what happens after. By connecting the two, you get the full story.
For example, an integrated system could show you that leads from a specific LinkedIn ad campaign not only converted, but also had a 25% higher lifetime value than leads from other channels. That's a game-changing insight you'd completely miss otherwise.
You can also layer in qualitative data by monitoring brand mentions and sentiment. Our guide on the best social listening tools can help you find the right platform to add that context to your quantitative tracking.
Turning Data into Actionable Decisions
All that data you've been collecting—every UTM tag, every conversion event, every attribution model—is just raw material. It holds a ton of potential, but its real power is only unlocked when you shape it into actual business intelligence. The mission is to get from a spreadsheet packed with numbers to a clear story that tells you exactly what to do next.
This is where marketing dashboards come into play. A well-built dashboard is far more than just a place to dump data; it's a decision-making engine. Tools like Google Looker Studio and Tableau let you visualize complex datasets, making it instantly obvious which channels are hitting the mark, where your budget is going to waste, and what new opportunities are just over the horizon.
Building Dashboards for Different Audiences
One of the most common missteps I see is creating a single, one-size-fits-all dashboard. The truth is, your marketing team and your CEO care about very different things. To measure marketing effectiveness in a way that actually lands with everyone, you have to tailor your reporting.
For the Marketing Team (The "In-the-Weeds" View): Your team needs granular, real-time data to make daily tweaks. This dashboard has to be tactical, breaking down performance by campaign, ad set, and even individual ad creative.
- Key Metrics: Click-Through Rate (CTR), Cost Per Click (CPC), Conversion Rate by Channel, and ROAS.
- Goal: To quickly spot what's working and what isn't, so they can double down on wins and cut losses fast.
For the C-Suite (The "Bottom-Line" View): Executives don't need the CTR of a specific Facebook ad. They need to see how marketing is moving the needle on major business goals. This dashboard should be strategic and high-level.
- Key Metrics: Customer Acquisition Cost (CAC), Customer Lifetime Value (LTV), LTV:CAC Ratio, and overall marketing ROI.
- Goal: To prove marketing's contribution to revenue and profit, justifying budgets and steering strategy. Getting a firm grip on your overall marketing ROI is crucial here, and you can learn more about how to calculate marketing ROI in our detailed guide.
A well-structured dashboard gives you that clean, at-a-glance view of performance that tells a story instantly.
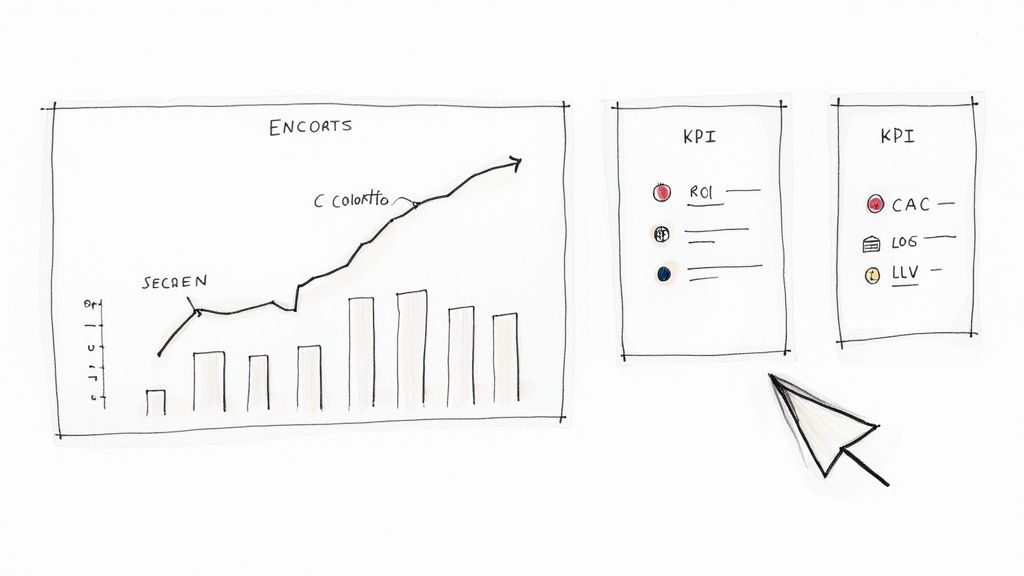
This kind of visual reporting makes it simple to spot trends, like a sudden dip in lead quality or a surge in sign-ups from an unexpected channel.
Going Deeper with Advanced Analysis
Your dashboards show you the "what," but to really understand performance, you have to dig into the "why." This means getting past surface-level metrics and using more advanced analysis to uncover the hidden patterns in how your customers behave.
Two of the most powerful ways to do this are cohort analysis and segmentation.
Cohort analysis is all about grouping users by a shared characteristic, usually when they signed up. For instance, you could create a cohort of every user who joined in January. By tracking this specific group over time, you can see how their behavior changes.
Cohort analysis helps you answer critical questions like, "Are customers we acquired in Q2 sticking around longer than those from Q1?" or "Did our recent product update actually improve long-term user retention?"
This shifts your perspective from a single point in time (like monthly churn) to a much deeper understanding of long-term customer value.
Segmentation, on the other hand, is about slicing your audience into subgroups based on who they are or what they've done. You can segment by just about anything:
- Demographics: Age, location, industry.
- Behavior: Users who have made multiple purchases vs. one-time buyers.
- Acquisition Source: Customers from organic search vs. paid social ads.
For example, a SaaS company might discover through segmentation that users acquired through their blog have a 30% higher LTV than those who came from paid ads. That's a powerful, actionable insight that tells them exactly where to invest their next marketing dollar.
Mastering the Art of Data Storytelling
Finally, the most important part of turning data into decisions is how you present it. Your job isn't just to spit out numbers; it's to build a compelling story around them. A good data story doesn't just state the facts—it offers an interpretation and a clear path forward.
A powerful report often follows this simple framework:
- Here’s What We Saw: Start with the key finding. (e.g., "Our cost per acquisition jumped by 15% in Q3.")
- Here’s Why We Think It Happened: Give context and your best guess. (e.g., "This was driven almost entirely by increased competition on our core keywords in Google Ads.")
- Here’s What We're Going to Do About It: Propose a clear, actionable plan. (e.g., "We will reallocate 20% of our search budget to test emerging long-tail keywords and scale our top-performing LinkedIn campaign.")
This approach takes you from being a data reporter to a strategic advisor. It shows you not only know how to measure marketing effectiveness but, more importantly, how to use those measurements to drive the business forward.
Optimizing Performance with Continuous Experimentation
Measurement isn’t a one-and-done job. It’s the engine for a constant cycle of learning and improvement. Once your dashboards are showing you what's happening, it's time to dig into the why—and more importantly, the what if. This is where building a culture of experimentation turns your data from a rearview mirror into a steering wheel.
The best marketing teams don't just measure what happened; they actively shape what happens next. They treat their marketing channels less like fixed assets and more like dynamic labs. Every landing page, email subject line, ad creative, and call-to-action is a chance to learn something new about what makes their audience tick. This mindset is how you find those small, incremental gains that snowball into massive growth over time.
This process of constantly testing and refining is how you find the small hinges that swing big doors.
Running Meaningful Marketing Experiments
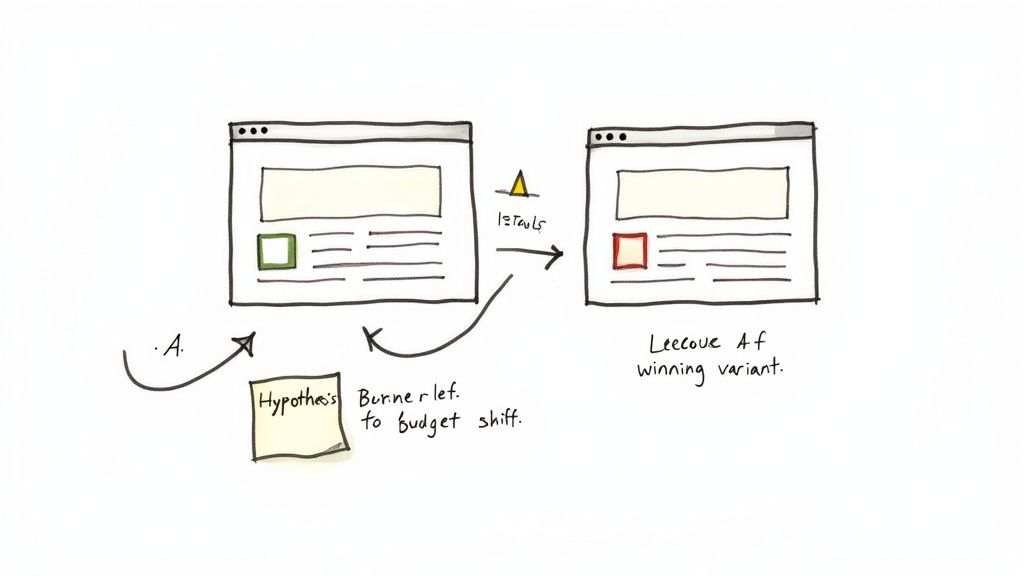
Experimentation can sound intimidating, but it really just boils down to making an educated guess and then testing it in a controlled way. The most common tool for this is the classic A/B test (or split test), where you pit two versions of something against each other to see which one performs better for a specific goal.
A solid experiment always starts with a clear hypothesis. "Let's test a blue button" is a weak hypothesis. A much stronger one sounds like this: "We believe changing the button color from green to orange will increase form submissions because orange has a higher contrast against our background, making the CTA pop." See the difference?
To run a clean test you can trust, you need a few key ingredients:
- A Clear Hypothesis: Spell out what you think will happen and why. This forces you to be strategic instead of just throwing things at the wall.
- Isolate One Variable: If you change the headline, the button color, and the main image all at once, you'll have no idea which change actually drove the result. Test one thing at a time.
- Statistical Significance: Don’t call a test after a handful of conversions. Use a sample size calculator to make sure your results aren't just a random fluke.
A failed experiment is never a failure—it's a learning opportunity. When a hypothesis is proven wrong, you've gained a valuable insight into your audience's behavior that you didn't have before.
I once worked with a SaaS company that tested adding customer logos above their pricing tiers. The hypothesis was that this social proof would boost free trial sign-ups. The result? Conversions actually dropped by 10%. It turned out the logos were distracting people from the main goal. It felt like a "failed" test, but it was an incredibly valuable lesson.
From Insights to Budget Optimization
Your attribution data and experiment results are the roadmap for spending your money wisely. They give you the hard evidence you need to confidently shift your budget away from channels that are just spinning their wheels and pour it into the ones delivering real value.
For instance, your dashboard might show that LinkedIn ads are bringing in leads with a Customer Acquisition Cost (CAC) of $250, while leads from Google Ads cost $400. On the surface, the choice is obvious: move more money to LinkedIn.
But hold on. A deeper dive into your attribution and CRM data might show that the Google Ads leads have a 30% higher Customer Lifetime Value (LTV) and close twice as fast. Suddenly, the more expensive lead is actually the more profitable one. This is exactly how sophisticated measurement stops you from making shortsighted optimization mistakes.
This process of reallocating your budget needs to be dynamic. I recommend reviewing channel performance and tweaking your spend at least monthly, if not weekly. This agility lets you jump on emerging trends and quickly cut your losses on campaigns that aren't working. It builds a data-driven culture where decisions are backed by evidence, not just gut feelings, and it’s the key to maximizing your overall marketing ROI.
Answering Your Toughest Marketing Measurement Questions
Even with the best framework in place, the real world of marketing measurement is messy. You're going to hit roadblocks. Over the years, I've seen marketers run into the same practical challenges again and again, from picking the right tools to justifying their work when the sales cycle feels like an eternity.
Let’s dig into some of those frequent questions and get you some straight answers.
A classic one is, "How often should I even be looking at this stuff?" It's tempting to stare at real-time dashboards all day, but that’s a recipe for making reactive, emotional decisions based on normal daily blips.
For most campaigns, a weekly check-in is the right cadence for tactical tweaks. Are click-through rates dropping? Is a new ad creative underperforming? A quick look once a week is perfect for that. For the big-picture strategic moves, like shifting your budget between channels, stick to a monthly or quarterly review. That gives you enough data to see real trends, not just noise.
How Do I Prove My Worth with a Long Sales Cycle?
This is the big one. When a deal takes six months or more to close, how do you show that the blog post a prospect read in month one actually mattered? If you’re only looking at what they did right before they signed the contract, you're missing the entire story. Last-touch attribution is your enemy here.
The key is to shift your focus from the final destination to the crucial milestones along the way. Think of them as leading indicators of a future sale.
Here's what to track instead:
- Lead-to-MQL Rate: Are you generating leads that sales actually agrees are qualified? This is a huge first step in proving value.
- MQL-to-SQL Rate: Are those Marketing Qualified Leads turning into legitimate Sales Qualified Leads and getting added to the pipeline?
- Sales Cycle Velocity: Can you show that leads who engaged with your content are closing faster than those who didn't?
By focusing on these pipeline metrics, you can build a compelling case for marketing's impact long before the deal officially closes.
Don't wait six months to claim a win. For long sales cycles, the best measure of marketing effectiveness is how well you accelerate a customer's journey through the funnel.
What If I'm Working with a Tiny Budget?
When you have limited funds, every single dollar has to pull its weight. This is where precise measurement isn't just a nice-to-have; it's a survival mechanism. Forget about fuzzy, hard-to-measure brand campaigns for now.
Your entire focus should be on channels where the line between spend and result is crystal clear. A highly targeted Google Ads campaign with meticulous conversion tracking is a perfect example. You can see exactly what a click costs and whether it led to a signup.
Start there. Find one or two channels you can measure cleanly, prove they work, and then reinvest the returns into exploring other opportunities. If you're looking for more in-depth strategies, this guide on how to measure marketing campaign effectiveness offers some great, practical models, especially for lean teams.
The guiding principle here is discipline. Track everything, start small, and only scale what you can prove is generating a positive return.
At Replymer, we're obsessed with turning authentic online conversations into measurable growth. Our service helps you get your brand recommended in relevant discussions happening right now on Reddit, X, and LinkedIn. We give you a clear dashboard to track every mention and reply, so you can see the direct inbound interest it creates. Learn how to build compounding demand with real dialogue at https://replymer.com.


