
Calculating your share of voice boils down to a simple, yet powerful, formula: you take your brand's performance on a key metric, divide it by the total for the entire market, and multiply by 100.
That’s it. The formula is (Your Brand Metric / Total Market Metric) x 100.
So, if your ads on a platform get 3,000 impressions out of a total 10,000 impressions available for your target keywords, your share of voice in paid search is 30%. It’s a direct measure of your visibility against the competition.
Understanding Share of Voice and Why It Matters

Before we get buried in spreadsheets, let's get a handle on what Share of Voice (SOV) really is. Think of it as your brand's slice of the conversation pie. It’s a straightforward benchmark that tells you how visible you are compared to everyone else you're competing with. For a solid primer on the concept, this guide on What Is Share of Voice? from Headline Marketing Agency is a great starting point.
Knowing your SOV isn't just a "nice-to-have" metric; it's a strategic must. It answers the fundamental question: "How much of the market's attention do we actually have?" It’s one of the most honest health checks for your brand, showing you how well your marketing is actually breaking through all the noise.
The Strategic Value of Measuring SOV
Figuring out your share of voice isn't just about getting a snapshot of where you are today. It’s about building a map for where you need to go. It helps you set achievable goals, spot competitive movements, and see the real impact of your campaigns over time. When you track SOV consistently, you start to see patterns and opportunities you would have otherwise missed.
Share of Voice is the ultimate competitive benchmark. It tells you not only how loud you are but also how much room there is to grow. A rising SOV is often a leading indicator of future market share growth.
By measuring SOV across all your channels—social, search, display—you get a much more detailed picture of what's working and what isn't. You might find you're crushing it on social media but are practically a ghost in organic search. That’s the kind of insight that helps you allocate your budget and team's time wisely.
For a practical example, look at paid search. Google Ads provides a metric called Impression Share, which is basically a pre-packaged SOV for your campaigns. If your impression share is 40%, it means for every ten searches where your ad could have shown, it appeared four times. That's a clear, actionable SOV right there.
Here's a quick look at how the formula and primary metric adapt to different marketing channels.
Share of Voice Calculation at a Glance
| Channel | Primary Metric | Example Formula |
|---|---|---|
| Paid Search (PPC) | Impressions | (Your Impression Share / 100) or (Your Impressions / Total Market Impressions) x 100 |
| Organic Search (SEO) | Clicks or Impressions | (Your Organic Clicks / Total Search Volume for Keywords) x 100 |
| Social Media | Mentions or Hashtags | (Your Brand Mentions / Total Mentions for All Brands) x 100 |
| Display & Programmatic | Ad Impressions | (Your Ad Impressions / Total Target Audience Impressions) x 100 |
This table shows that while the core concept remains the same, the specific metric you use to measure "voice" will change depending on the channel you're analyzing.
Key Benefits of Tracking Share of Voice
Keeping a close eye on your SOV gives you a real competitive advantage. It forces your team to think beyond surface-level vanity metrics and develop a much deeper understanding of the market dynamics at play.
Here’s what you stand to gain:
- Competitive Analysis: You get a direct, apples-to-apples comparison against your rivals. It shows you exactly who is capturing your audience's attention and where.
- Campaign Measurement: It helps you measure the true impact of your marketing. Did that expensive new product launch actually make a dent in the market conversation? Now you'll know.
- Strategic Planning: By seeing where your SOV is weak, you can instantly identify opportunities for growth and shift your budget to where it will make the most difference.
- Brand Health Monitoring: A slipping SOV can be an early warning sign. It might mean a competitor is getting more aggressive or your messaging is off, giving you a chance to act before it hits your bottom line.
Gathering Your Data and Essential Tools
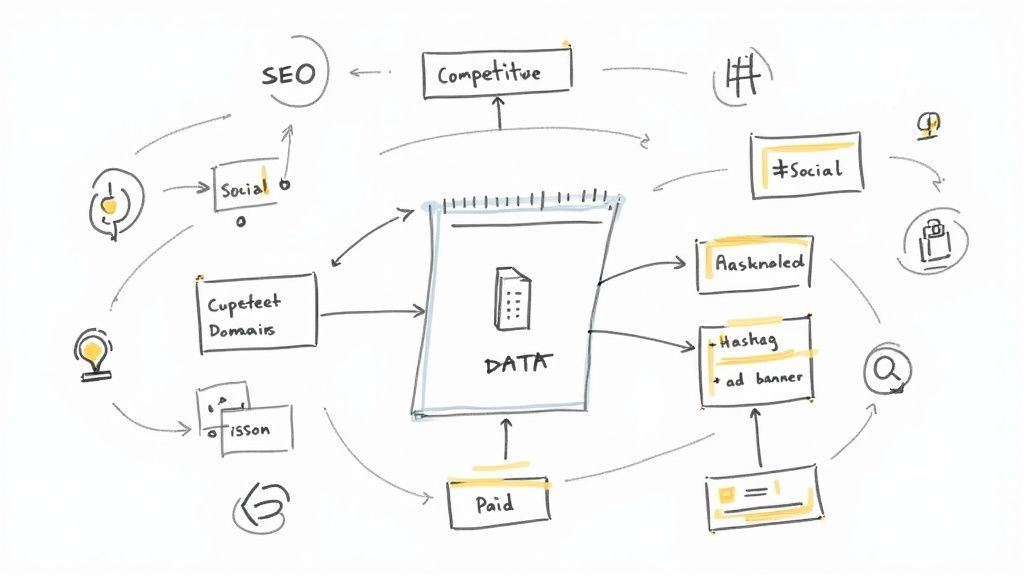
Before you can even think about plugging numbers into a formula, you need the right data. You can’t measure share of voice in a vacuum. The whole process starts with building a clear “market map” of your competitive landscape.
Think of it as the foundation for your entire SOV analysis. It’s not just a random list of companies you think you compete with. It’s about defining who is actually talking and how loud they’re talking in the specific arenas where you’re trying to win.
Building Your Competitor Market Map
Your first move is to pinpoint 3-5 direct competitors for each channel you’re measuring. This is a critical distinction—the brands you’re up against in organic search often aren't the same ones you’re battling on paid social.
Get specific and collect the right assets for each channel:
- Organic Search (SEO): Make a clean list of your top competitor domains (e.g.,
competitorA.com,competitorB.net). - Paid Media (PPC): Find the brands that show up time and again for your most important keywords. You can usually spot these right inside your Google Ads account.
- Social Media: Grab the official handles or page URLs for your rivals on platforms like X (Twitter), LinkedIn, or Instagram.
This market map is the bedrock of a reliable SOV calculation. Skip this step, and your final numbers will be fuzzy at best, and downright misleading at worst.
Essential Tools for Data Collection
With your map in hand, it’s time to find the right tools for the job. Manually digging for this data is a recipe for frustration and inaccuracy. The right platforms will pull the metrics you need with speed and precision.
For organic search, tools like Ahrefs and Semrush are non-negotiable. You can plug in your competitor domains and see exactly who is winning on the keywords that matter to you, backed by real data on rankings and estimated traffic.
The biggest mistake I see teams make is trying to measure their SOV against the entire internet. Your real share of voice is a measure of your visibility against the handful of competitors actively fighting for your audience's attention.
On the social media front, you need to track conversations at scale. This is where social listening tools shine. Platforms like Brandwatch, Mention, and Sprout Social are built to monitor millions of public posts for mentions of your brand versus your competitors. If you're weighing your options, this detailed social listening tools comparison is a great place to start.
Pulling Data from Native Platforms
Finally, don’t forget about the goldmine of data sitting right inside your ad platforms. For paid media, this is often the most accurate source you can get.
- Google Ads: The metric you’re looking for is Impression Share. It’s available directly in your campaign reports and literally tells you what percentage of available impressions your ads captured. It’s a direct SOV calculation, handed to you on a platter.
- Meta Ads (Facebook/Instagram): Meta doesn't have a direct "Impression Share" metric, but you can get a solid estimate. Just compare your campaign’s reach to the total potential audience size that Ads Manager provides when you set up your targeting.
By combining powerful third-party tools for organic and social with the first-party data from your ad accounts, you build a much more complete and reliable picture. This groundwork ensures that when you actually start calculating, the results will give you a true sense of where you stand.
How to Calculate SOV Across Your Key Channels
Knowing the theory behind share of voice is one thing, but actually calculating it is where the rubber meets the road. The core idea is always the same—your brand's visibility versus the competition—but the specific metrics you’ll use will change completely depending on the channel you're looking at.
Let’s get practical and break down exactly how to measure your brand’s presence across organic search, paid ads, social media, and PR. Each channel tells a unique part of your brand’s story, and having a high SOV in one area can easily mask a serious blind spot in another.
For Organic Search: Focus on Keyword Visibility
When we talk about SOV in organic search, the best way to measure it is with keyword visibility. This is so much more powerful than just tracking rankings because it weighs keywords by their search volume. After all, what’s more valuable: ranking #1 for a term with 10 monthly searches, or ranking #1 for one with 10,000?
Keyword visibility gives you a true sense of your share of the actual traffic available.
To figure this out, you’ll first need a tight list of the keywords that matter most to your business.
- Pull your data. Grab a tool like Ahrefs or Semrush to find your estimated click-through rate (CTR) for each keyword based on where you rank. You’ll also need the monthly search volume for every term.
- Estimate your traffic. For each keyword, just multiply its monthly search volume by your CTR. That gives you a solid estimate of the organic traffic you're getting from that specific term.
(Search Volume x CTR = Your Estimated Traffic) - Find your SOV. Add up the estimated traffic from all your target keywords. This is your total. Then, do the same for your competitors. Your SOV is your traffic divided by the total market traffic.
A Real-World Example
Imagine you and two competitors are all fighting for the term "CRM for startups."
| Keyword | Total Monthly Searches | Your Rank & CTR | Competitor A Rank & CTR | Competitor B Rank & CTR |
|---|---|---|---|---|
| "CRM for startups" | 5,000 | #2 (15%) | #1 (25%) | #5 (5%) |
| "small business CRM" | 3,000 | #4 (8%) | #3 (12%) | #7 (3%) |
Here’s how the math shakes out:
- Your Estimated Traffic: (5,000 * 0.15) + (3,000 * 0.08) = 990
- Total Market Traffic: 990 + (1250+360) + (250+90) = 2,940
- Your SEO Share of Voice: (990 / 2,940) x 100 = 33.7%
Boom. You now know you own just over a third of the organic conversation for these critical keywords.
For Paid Media: Use Impression Share
With paid media, things get much simpler, especially on platforms like Google Ads. They basically do the work for you with a beautiful metric called Impression Share.
Impression Share tells you the percentage of times your ads were shown out of the total number of times they could have been shown. It's a direct, ready-made measure of your paid SOV.
If your Impression Share is 60%, it means that for every 10 searches where your ad was eligible to appear, it only showed up 6 times. The other 40% of impressions either went to your competitors or were lost because your budget was too low or your ad rank wasn't good enough.
You can find this data right inside your Google Ads account, and you can slice it by campaign, ad group, or even individual keywords. This is where you can find some powerful insights. For instance, you might see an 85% impression share on your branded terms but a dismal 15% on high-intent, non-branded keywords. That’s a crystal-clear signal telling you exactly where you need to invest more.
To help you keep these formulas straight, here’s a quick cheat sheet.
SOV Calculation Cheat Sheet by Channel
This table is a handy reference for calculating SOV across your main channels, outlining the go-to formula and the data sources you'll need.
| Channel | Formula | Primary Data Source |
|---|---|---|
| Organic Search | (Your Estimated Traffic / Total Market Traffic) x 100 | SEO Tools (Ahrefs, Semrush) |
| Paid Media | (Your Impressions / Total Eligible Impressions) x 100 | Ad Platforms (Google Ads, etc.) |
| Social Media | (Your Brand Mentions / Total Mentions) x 100 | Social Listening Tools (Brandwatch, etc.) |
| PR / Earned Media | (Your Media Placements / Total Placements) x 100 | PR Monitoring Tools (Cision, Prowly) |
Keep this nearby, as it’s a great way to quickly remember how to approach SOV for any given channel.
For Social Media: Track Brand Mentions
On social media, share of voice isn't about clicks or impressions—it's about the conversation. You’re measuring how often people are talking about your brand compared to your competitors. To do this at any kind of scale, you absolutely need a social listening tool.
The formula itself is super simple:
(Your Brand Mentions / Total Brand Mentions (You + Competitors)) x 100
Let's say you run a project management software company. In the last 30 days, your social listening platform picked up the following:
- Your Brand: 1,200 mentions
- Competitor A: 2,500 mentions
- Competitor B: 800 mentions
- Total Mentions: 1,200 + 2,500 + 800 = 4,500
Your social SOV would be: (1,200 / 4,500) x 100 = **26.7%**. This tells you that while you’re in the game, Competitor A is absolutely dominating the conversation right now. Remember, mentions are just the starting point; you'll get far richer insights when you also measure social media engagement alongside your SOV.
For PR: Quantify Your Earned Media
In public relations, SOV is all about tracking your visibility in earned media—we're talking news articles, blog features, reviews, and other media placements. It’s a fantastic way to prove the value of your PR work.
The calculation is pretty much the same as the one for social media, but you’re counting media articles instead of social posts. You can dig deeper into how PR professionals use share of voice to benchmark their campaign success.
For a quick example, if your company landed 250 media placements in Q1 and your competitors collectively got 750, the total market conversation is made up of 1,000 articles.
Your PR SOV is: (250 / 1,000) x 100 = **25%**. This gives you a clean, powerful number to show how your PR efforts are directly contributing to brand awareness.
Applying SOV to Retail Media and Niche Platforms
Share of voice isn't just a game for Google and the big social networks. The same core ideas work just as well in the specialized corners of the internet where your audience actually hangs out—think e-commerce marketplaces and niche forums. The trick is to adapt the metric to what "visibility" really means on each platform.
This is absolutely critical in retail media, especially on a juggernaut like Amazon. Here, share of voice isn't some abstract concept; it's directly tied to sales. Getting seen on a search results page or a key category page can mean the difference between a best-seller and a total flop.
Calculating SOV in Retail Media
In the world of e-commerce, SOV is often called Share of Shelf. It's a direct measure of how much digital real estate your products occupy compared to your competitors, counting both organic and sponsored spots.
A straightforward way to get a handle on this is by tracking ad impressions. In this context, Share of Voice is simply the percentage of ad impressions your brand gets compared to the total for your category. For example, if your Amazon ads pulled in 1,000 impressions last month and all your competitors combined had 10,000, your SOV is 10%. There's a lot more to dig into on SOV in the retail media space, and it’s well worth the read to understand its direct link to e-commerce growth.
This flowchart maps out how the SOV calculation process connects across different marketing channels.
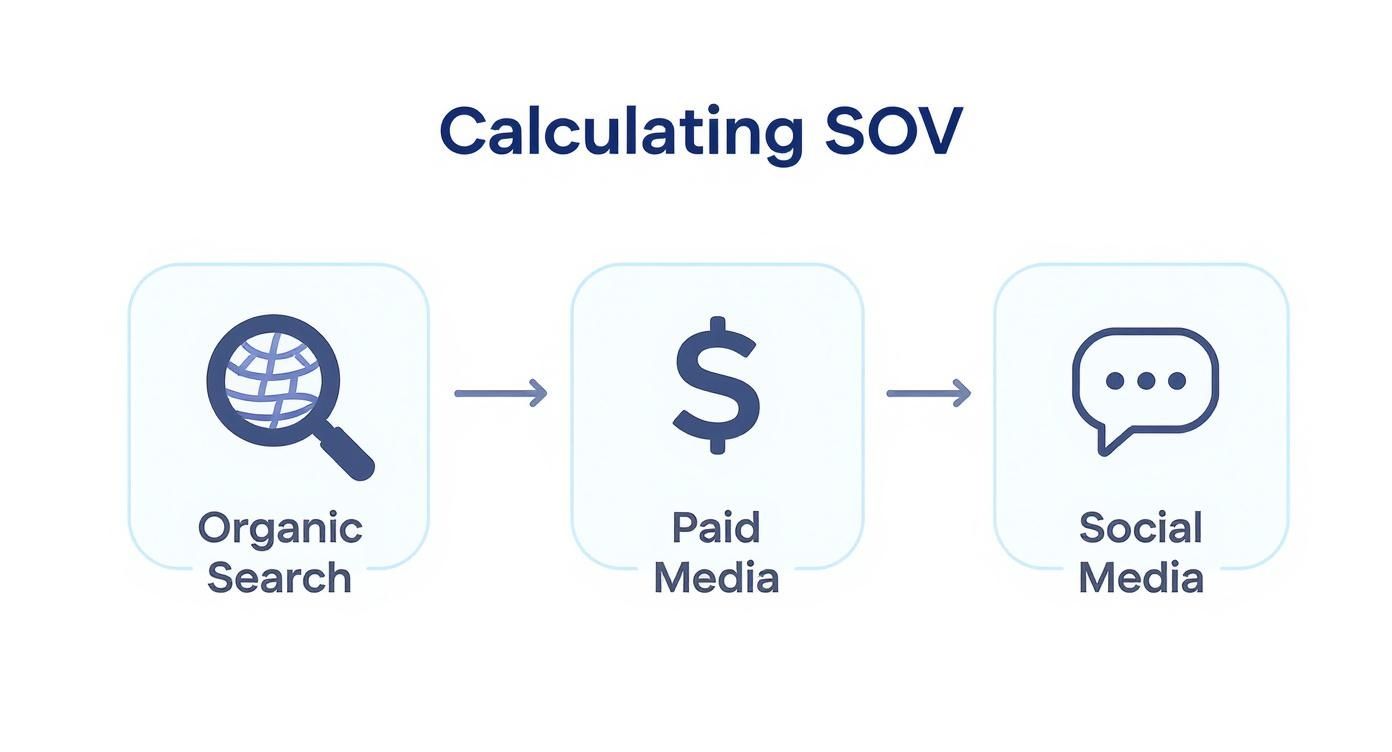
As you can see, even though the channels and specific metrics change, the fundamental approach of measuring your slice of the pie remains the same.
Another powerful tactic, especially for retail, is to calculate SOV based on specific, high-intent keywords. If you sell high-end coffee makers, you don’t care about general visibility; you care about owning the results for a term like "espresso machine with grinder."
- Pick your keywords: Start with 5-10 of your most important, non-branded keywords.
- Count the placements: Search for each keyword and tally how many of the top 20 results—sponsored and organic—are yours.
- Calculate your share: Repeat the process for your top three competitors. If you own 4 of those top 20 spots, your share of shelf for that term is 20%.
By tracking this over time, you can clearly see if your ad spend and SEO work are actually stealing digital shelf space from your rivals.
Adapting SOV for Niche Communities
Your customers don’t just shop; they also gather in smaller, super-engaged communities on platforms like Reddit, industry forums, or even Slack groups. Calculating a traditional SOV here is less about raw impressions and more about the quality of the conversation.
In these spaces, the metric shifts from pure visibility to something closer to influence and trust.
For these tight-knit communities, consider tracking alternative SOV metrics that better reflect what's happening on the ground:
- Share of Positive Mentions: How often is your brand mentioned positively or neutrally compared to competitors? This cuts through the noise and focuses on what really matters—favorable chatter.
- Share of Recommendations: In a subreddit like r/BuyItForLife, how many times is your product authentically recommended versus the other guys? This is a fantastic proxy for genuine brand advocacy.
- Share of Expert Voice: In a professional forum, how often are people from your company or known brand advocates quoted as the go-to source? This measures thought leadership where it counts.
The core principles of calculating share of voice can be adapted to create a meaningful benchmark for virtually any platform. The goal is always the same: understand how visible you are compared to the competition in the places that your audience trusts most.
Turning Your SOV Numbers Into Actionable Strategy
So, you've got your share of voice numbers. Great. But that's just the starting line. Raw data is interesting, but it doesn't become valuable until you translate it into a clear roadmap for growth.
An SOV report gathering dust in a folder won’t help anyone. Your real job is to connect those numbers to the strategic decisions that will actually push your brand forward.
Benchmarking Against Your Competitors
The first thing you have to do is put your data in context. An SOV of 25% means absolutely nothing on its own. But if you know your top rival is sitting at just 15%, suddenly you have a story to tell.
Use your calculations to build a competitive matrix that clearly shows where you're winning and where you're lagging. This will immediately spotlight the channels that need your attention.
- Find Your Strongholds: Where is your SOV the highest? That's where you double down. If you're dominating on social media, that’s your launchpad for new products or big brand announcements.
- Identify Your Blind Spots: Is your paid search SOV a dismal 5%? That’s a massive red flag. It’s telling you that your bidding strategy, ad copy, or budget allocation needs a serious rethink.
- Spot Incoming Threats: Did a competitor's SOV suddenly spike on a key channel? That’s an early warning sign. They’ve likely launched a new campaign, and you need to figure out what they’re doing before they steal too much ground.
This kind of competitive view transforms abstract percentages into a strategic game plan. You'll know exactly where to defend your turf and where to go on the attack.
Tracking SOV to Prove Marketing ROI
One of the best ways to use share of voice is to track it over time. This turns a one-off snapshot into a living, breathing measure of your marketing performance. Remember that huge content push you did in Q2? Your SOV trend line will tell you if it actually moved the needle on your organic visibility.
A consistent increase in your share of voice is a powerful leading indicator of future market share growth. It demonstrates that your marketing efforts are successfully capturing more of your audience's attention, which is a crucial first step toward capturing their business.
By mapping your SOV against your campaign calendar, you can build a compelling narrative about your team’s impact. This is how you prove your value. For those looking to tie these efforts directly to the bottom line, learning how to calculate marketing ROI is the logical next step.
Translating Insights Into Concrete Actions
After the analysis comes the action. The entire point of collecting this data is to make smarter decisions. You can explore a variety of data-driven marketing strategies to find what works best based on where you stand.
Here’s how a few different SOV scenarios might guide your next move:
| SOV Scenario | Potential Strategic Action |
|---|---|
| Low Organic SOV | Run a content gap analysis against your top competitors. Find the keywords they rank for that you don't, then build a content plan to target those gaps. |
| Declining Paid SOV | Time for a full audit of your Google Ads account. You might need to raise bids on your best-performing keywords or seriously refine your audience targeting. |
| High Social SOV | Capitalize on your strong community. Launch a user-generated content campaign or start an ambassador program to amplify your reach even further. |
| Low PR Mentions SOV | Get proactive with media outreach. Identify the journalists and publications covering your competitors and start building relationships. |
At the end of the day, calculating share of voice isn't just a math problem. It’s a diagnostic tool. It shows you where your brand is healthy and where it needs immediate attention, giving you a clear, data-backed path to outmaneuvering the competition.
Common Questions About Share of Voice
Once you start working share of voice into your reporting, a few questions always seem to pop up. Getting ahead of them helps you set the right expectations with your team and use the metric for what it’s really worth.
Let's dig into some of the most common ones I hear.
The first is usually, "How often should we even measure this?" And the honest answer is, it really depends on the channel and how fast your market moves.
For channels that change on a dime, like paid media or social, you’ll want to check in weekly or bi-weekly. Ad auctions and online conversations can shift dramatically in just a few days. For slower-moving channels like organic search (SEO), a monthly or quarterly look is usually plenty. It just takes more time for strategy to translate into visibility there.
What Is a Good Share of Voice Score?
This is the big one. Everyone wants to know the magic number, but the truth is, a "good" score is completely relative.
An SOV of 15% could be a massive win in a crowded market with ten other players fighting for attention. But in a two-horse race, a 40% SOV might be a huge red flag if your main competitor owns the other 60%.
The goal isn't to chase some universal percentage. It's about knowing where you stand in your specific arena.
Your target SOV should be benchmarked against the competitors who actually matter to your business, not an industry-wide average. The real victory is a consistently upward trend—proof that you're steadily winning more of your market's attention.
To figure out what "good" looks like for you, focus on these benchmarks:
- Your Closest Rival: Are you gaining on them or falling behind?
- The Market Leader: What's the gap between you and the top dog?
- Your Own Performance: Is your SOV growing, shrinking, or stagnating over time?
This context is what transforms SOV from a vanity metric into a real strategic compass.
Can You Create One Unified SOV Score?
I get why people ask this. A single, blended score that rolls up search, social, and PR into one number sounds clean and simple. In reality, it's usually a terrible idea that creates more confusion than clarity.
Trying to combine these metrics is like adding apples and oranges. An ad impression just isn't the same as an earned media mention, and a top organic ranking has a completely different value than either. Each channel's "voice" carries a different weight and intent. Think about it: a single feature story in a major trade publication could easily be worth more than a thousand fleeting social mentions.
Instead of chasing a single, blended number, I always advise teams to maintain a channel-specific SOV dashboard.
This approach gives you a much cleaner, more actionable picture. You can immediately see if your dominance on social media is hiding a serious weakness in organic search—an insight that would be totally lost in a unified score.
Ready to start capturing more of the conversation for your brand? Replymer turns authentic discussions on Reddit, X (Twitter), and LinkedIn into a source of compounding demand. Our team of real writers monitors keywords 24/7 and crafts human-written replies that build trust and drive qualified leads, all on autopilot. Learn how Replymer can grow your share of voice today.


