
Let's get one thing straight: follower count doesn't mean much on its own. If you really want to know how your account is doing on X, you need to learn how to calculate your Twitter engagement rate. This one number is the true pulse of your audience, showing you who's actually paying attention.
It tells a much richer story about your account's health and how well your content is landing than any vanity metric ever could.
Why Twitter Engagement Is Your Most Important Metric
In a feed that’s more crowded than ever, just collecting followers isn't a winning strategy. The real proof of a healthy X account is seeing how many people are actually interacting with your tweets. Think of your engagement rate as the ultimate diagnostic tool for your entire strategy.
A high engagement rate is the clearest signal that your content is hitting the mark. It means you're not just broadcasting into an empty room—you're building real connections. When someone takes the time to like, reply, or retweet, they're giving your message a thumbs-up.
This kind of active participation is exactly what the X algorithm loves to see, which often translates into better visibility for your future posts.
Moving Beyond Vanity Metrics
Chasing follower numbers can be a fool's errand. What good is a massive audience if they're completely silent? Tracking engagement, on the other hand, helps you make smart, data-driven decisions that actually move the needle.
- Content Resonance: High engagement is concrete proof that your topics, tone, and formats are what your audience craves.
- Community Building: Every interaction is a building block for your community. A simple reply can be the start of a valuable relationship.
- Business Value: An engaged audience is far more likely to click your links, trust what you say, and eventually buy from you.
By focusing on engagement, you stop just collecting followers and start building an active, loyal audience that genuinely cares about what you have to say.
Ultimately, understanding this metric lets you stop guessing and start making strategic improvements. It's also helpful to see how this fits into the bigger picture of social media engagement metrics to build a smarter, more effective strategy overall.
When it comes to calculating your Twitter engagement rate, you'll quickly find there isn't one single "right" way to do it. The two most common methods—calculating by impressions and by followers—are both valuable, but they tell you completely different things about your performance.
Picking the right formula really just depends on what you're trying to figure out. Think of it like this: the impression-based rate is like analyzing one specific play in a football game, while the follower-based rate is your team's overall season average. You need both to get the full story.
This infographic lays out exactly why keeping a close eye on engagement is so critical for your content, your community, and ultimately, your bottom line.
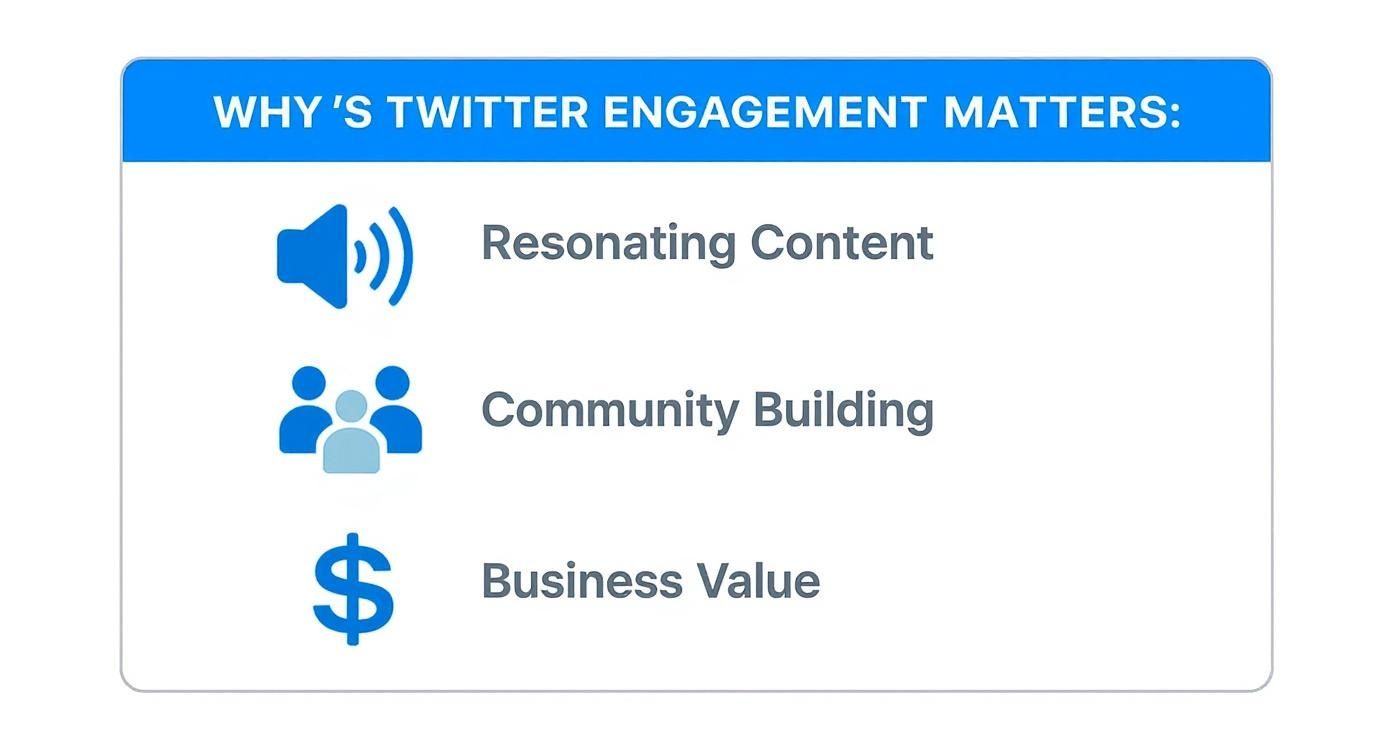
As you can see, strong engagement is the bridge connecting your content's performance to real community growth and tangible business results.
To make it easier to decide which formula to use, here’s a quick breakdown of the two main approaches.
Two Core Methods to Calculate Twitter Engagement Rate
| Metric | Engagement Rate by Impressions | Engagement Rate by Followers |
|---|---|---|
| The Formula | (Total Engagements ÷ Impressions) x 100 | (Total Engagements ÷ Followers) x 100 |
| What It Measures | The percentage of people who saw a tweet and then interacted with it. | The percentage of your followers who engaged with your tweets over a period. |
| Best Use Case | Best for analyzing the performance of a single tweet or A/B testing content. | Best for measuring your overall account health and community activation over time. |
Each method gives you a unique lens through which to view your performance. Let’s dig into when and why you’d use each one.
Engagement Rate by Impressions
This is the formula you'll probably use most often. It’s the most direct way to judge how effective a single tweet was at grabbing attention. It answers a simple but powerful question: "Of all the people who saw this tweet, how many actually did something?"
This makes it the perfect metric for A/B testing different types of content, calls-to-action, or even tweet formats.
The math is simple:
(Total Engagements ÷ Total Impressions) x 100
What counts as an "engagement" here? Pretty much everything. We’re talking likes, replies, retweets, video views, link clicks, profile clicks—even clicks just to expand the tweet. Because it’s based on the actual number of people who saw the post, it's the purest measure of a tweet's quality.
But be warned: capturing that attention is tough. Recent industry data shows the median engagement rate on X has fallen to a tiny 0.015%, a significant drop from 0.029% the previous year. It's a real fight for every single interaction out there.
Engagement Rate by Followers
While the impressions formula is your go-to for individual posts, the follower-based calculation gives you a much broader, C-suite-level view of your account's health. This approach isn't about one viral tweet; it’s about how consistently you're activating your own audience—the people who made a conscious choice to follow you.
Here’s the formula:
(Total Engagements on a Set of Tweets ÷ Total Followers) x 100
You’ll want to use this to measure performance over a specific timeframe, like a week or a month. For example, you could sum up all the engagements on all your tweets from May, divide that by your follower count, and multiply by 100.
This gives you a stable, reliable benchmark for your account. Your follower count doesn't fluctuate wildly day-to-day like impressions can, so it's a great way to track if your community is becoming more or less responsive over time.
If you're looking to build a more comprehensive dashboard, our guide on how to measure social media engagement can help you apply these concepts across all your platforms.
Putting These Formulas to Work in the Real World
Knowing the formulas is just the start. The real magic happens when you use them to dissect your strategy and figure out what’s actually working. This is where the numbers stop being abstract and start telling you a story.
Let's walk through how to do this with a couple of practical scenarios.
We'll follow a hypothetical B2B SaaS company, "InnovateSphere," to see these calculations in action. This should give you a clear roadmap for crunching your own numbers right away.
Gauging the Impact of a Single Tweet
Imagine InnovateSphere just announced a new product integration on X. They want to see how it landed with their audience right now. For this kind of instant feedback, the engagement rate by impressions formula is perfect.
Here’s a quick look at the data from their X Analytics for that tweet:
- Total Engagements: 315 (This includes every like, reply, link click, etc.)
- Impressions: 15,000
Now, we just pop those numbers into the formula:
(315 Engagements / 15,000 Impressions) x 100 = 2.1%
So, the engagement rate for this specific tweet is 2.1%. That's a strong result, especially since the average for the tech industry hovers around 2.2%. This tells the team at InnovateSphere that the announcement was relevant and interesting to the people who saw it. It’s a green light to create more content just like it.
Taking a Look at Monthly Account Health
Next up, InnovateSphere wants a bird's-eye view of their performance over the last month. To get this bigger picture, we’ll use the engagement rate by followers formula. It’s a fantastic way to see how consistently you're connecting with your core audience.
First, they’ll need to pull the numbers for the last 30 days:
- Total Engagements (across all tweets): 8,250
- Follower count (at the end of the period): 25,000
- Total tweets published in the month: 20
Let's run the calculation:
(8,250 Engagements / 25,000 Followers) x 100 = 33% (Total Engagement)
33% / 20 Tweets = 1.65%
The average engagement rate per post for the month comes out to 1.65%. This number is their new benchmark. If next month they hit 1.9%, they know they’re on the right track. But if it dips to 1.3%, it’s a clear signal to dig in and see what went wrong.
This kind of consistent tracking is non-negotiable for any brand that’s serious about growth. Once you know which topics and conversations get people talking, you can use those insights for more direct efforts, like using https://replymer.com/blog/social-media-for-lead-generation to turn that buzz into real business leads.
My Takeaway: Think of it this way—the per-tweet calculation helps you analyze your content, while the monthly calculation helps you review your strategy. You absolutely need both for a complete picture.
If you're dealing with a lot of data, manually gathering all these numbers can be a huge time sink. Using one of the best social media scrapers can automate the collection process, freeing you up to focus on what the numbers actually mean instead of just gathering them.
What’s a Good Engagement Rate, Anyway? Decoding the Numbers
So, you've calculated your engagement rate. Now for the million-dollar question: "Is my number any good?"
The honest, and perhaps frustrating, answer is... it depends. There’s no single, universal figure that defines a "good" engagement rate on X. It's a moving target that shifts based on your industry, follower count, and the kind of content you're putting out there.
Think about it. A global brand with millions of followers might celebrate a 0.5% engagement rate, while a niche creator with 5,000 die-hard fans could see 3% as just another Tuesday. Comparing a B2B tech company's stats to a B2C fashion influencer's is like comparing apples and oranges.
Finding Your True Benchmark
To get a real sense of how you're doing, you need to stop looking at platform-wide averages and start looking at industry-specific benchmarks. These numbers provide the context you need to set realistic goals and understand where you actually stand. Otherwise, you’re just shouting into the void.
Here’s a quick breakdown of average X engagement rates across a few sectors:
- Education: 2.4%
- Technology: 2.2%
- Financial Services: 2.1%
- Hospitality & Tourism: 2.0%
- Agencies: 1.7%
- Retail: 1.7%
As you can see, even a fraction of a percentage point can be the difference between an average and a high-performing account in your specific field.
Your goal shouldn't be to hit some vague, platform-wide average. Aim to consistently outperform the benchmark for your niche. That's the real sign of a winning content strategy.
How Follower Count Changes the Game
The size of your account is one of the biggest factors at play here. It’s a classic social media paradox: as your follower count goes up, your engagement rate often goes down.
Smaller, more niche accounts naturally build tighter communities where a larger chunk of the audience feels compelled to interact. The data backs this up. Influencers with over a million followers might average an engagement rate around 1.7%, whereas nano-influencers (with 1,000-10,000 followers) can pull in nearly 4.6%. It's also worth noting that verified accounts tend to get 41% more engagement, proving that a little blue check still goes a long way. If you want to dig into more data, these Twitter statistics and what they mean for your strategy are a great resource.
Ultimately, knowing how to interpret your engagement rate is what separates a good strategy from a great one. Understanding these benchmarks helps you connect your daily social media grind to real business results. For a deeper look at tying this all together, check out our guide on how to calculate marketing ROI and see how engagement plays into the bigger picture.
Common Mistakes People Make When Tracking Engagement
So, you've got your engagement rate calculated. That's a great first step, but the numbers are just numbers. The real trick is knowing how to read them without falling into the common traps that can completely mislead your strategy. Getting the math right is useless if you get the interpretation wrong.
One of the biggest mistakes I see is getting fixated on that one viral tweet. We've all had them—a post that just takes off for some reason. It's thrilling! But it's also an outlier. If you obsess over that one-hit-wonder, you'll end up ignoring the steady, reliable content that forms the backbone of your strategy. The goal is to lift your average performance, not just chase lightning in a bottle.
Comparing Apples to Oranges
Another classic error is measuring your performance against the wrong yardstick. A B2B software company is going to have wildly different engagement metrics than a B2C fashion brand. Their audiences are different, their goals are different, and their content is different. It’s a pointless comparison.
Instead, stick to benchmarks that actually make sense for you:
- Yourself, over time: This is the most important comparison. Is your engagement rate better this month than last? Are you trending up?
- Your direct competitors: Look at accounts in your specific niche. This gives you a much more realistic picture of what a "good" engagement rate looks like in your world.
- Your own content types: Pit your product announcements against your behind-the-scenes posts. This is how you figure out what your audience actually wants to see from you.
It also helps to keep the bigger picture in mind. The average engagement rate for a tweet across all industries is a tiny 0.045%. That means users engage with less than one out of every 2,000 tweets they scroll past. At the same time, the overall posting frequency on the platform has dipped by about 33% in the last year. Knowing these trends helps you set realistic goals and not get discouraged. You can explore more Twitter statistics and what they mean for marketers to get a better feel for the landscape.
The biggest mistake is treating all engagement as equal. Ten passive likes are not as valuable as one thoughtful reply that starts a conversation. The quality of interaction often matters more than the quantity.
Forgetting the 'Why' Behind the Numbers
Finally, don't just stare at the numbers—look at the nature of the interactions. A high engagement rate built on a mountain of simple likes tells a very different story than one driven by thoughtful replies and valuable shares.
Are people actually talking to you? Are they asking follow-up questions or tagging their friends? These are the signals that tell you if you're building a real community or just shouting into the void. High-quality engagement means your audience sees you as a credible source and genuinely values your input. When you sit down to analyze your metrics, always pair the hard data with this qualitative context. It’s the only way to get a true read on your account’s health.
FAQs: Your Twitter Engagement Questions, Answered
Alright, you've got the formulas, but let's be real—applying them often brings up more questions. It's one thing to know the math, and another to know what the numbers are really telling you. Let's dig into some of the most common questions I hear from people trying to make sense of their Twitter engagement.
Should I Use Impressions or Followers for My Calculation?
The short answer? You need both. They measure two totally different things, and each one gives you a critical piece of the puzzle.
Rate by Impressions: Think of this as your content quality score. It tells you how compelling a specific tweet was to the people who actually saw it. This is your go-to metric for A/B testing copy, analyzing campaign performance, and figuring out what resonates on a day-to-day basis.
Rate by Followers: This is your account health check. It gives you a broader, longer-term view of how well you're connecting with your core audience. Since it smooths out the spikes from a single viral hit, it’s perfect for weekly or monthly reports to track overall community growth and activation.
One tells you about the tweet, the other tells you about the tribe. Use them together for the full picture.
Where Can I Find All This Engagement Data?
Good news: you don’t need to pay for a fancy analytics suite to get started. Everything you need is already waiting for you inside X’s own native analytics.
Just head over to analytics.twitter.com and log in. You'll find a 'Tweets' dashboard that breaks down every single post, showing impressions, total engagements, and even the pre-calculated engagement rate for each tweet. You can also export the data for any date range you want, which is perfect for digging deeper in a spreadsheet.
Okay, But How Do I Actually Improve My Engagement Rate?
There's no magic button, but there is a reliable process. It really boils down to paying attention and being consistent.
First, go look at your best-performing content right now. What do those posts have in common? Are they videos? Questions? Do they hit on a specific topic? Double down on what's already working.
Next, stop just broadcasting and start conversing. Get in there and reply to people who mention you. Jump into relevant conversations. When people see you’re an active participant, they’re far more likely to engage with your content.
And please, use more visuals. Tweets with videos, high-quality images, or even a well-placed GIF almost always get more attention than plain text. Finally, play around with your timing. Post at different times of the day to see when your audience is most likely to be online and ready to interact.
The most important thing to remember is that engagement is a conversation, not a monologue. If you just post and leave, you're missing the point. Being present is the single fastest way to get people to pay attention.
Do Clicks on My Profile or Links Count Toward Engagement?
Yes, they absolutely do, and this is a point that trips a lot of people up.
X's definition of "engagements" is incredibly broad. It includes the obvious stuff like likes, retweets, and replies. But it also tracks all the smaller, often-overlooked interactions.
This includes clicks on:
- Your profile name or picture
- Any hashtags you've included
- Links you're sharing
- The media itself (to view a photo or play a video)
- Even just expanding the tweet to read the full text
Because it captures every single one of these micro-interactions, the "Total Engagements" figure is a really solid, comprehensive measure of how much your audience is actually paying attention to a post.
Ready to turn those online conversations into real growth? Replymer does the heavy lifting for you. Our team of expert writers finds the perfect discussions on X, Reddit, and LinkedIn, then crafts authentic, human replies that recommend your product naturally. Stop chasing algorithms and start building real demand. See how Replymer can grow your business on autopilot.


