Think of a social media analytics dashboard as your mission control. It takes all the chaotic, scattered data from your different social platforms and turns it into a clear, visual story about your performance. It shows you exactly what's working, what isn't, and why, so you can stop guessing and start making smarter decisions that actually drive growth.
Your Command Center for Social Media Growth
Trying to run a social media strategy without a proper dashboard is like flying a plane blindfolded. You're definitely moving, but you have no clue if you're heading toward a mountain or your destination. All those likes, comments, shares, and follows are a constant stream of information, but by themselves, they're just noise. An analytics social media dashboard is the cockpit that organizes that noise into actionable intelligence.
It’s just like your car's dashboard. A quick glance tells you your speed (engagement rate), how much fuel you have left (budget spend), and if the engine is running smoothly (brand sentiment). This kind of instant feedback is crucial for making quick adjustments on the fly. In the same way, your social media dashboard gives you one unified view, saving you from the headache of juggling dozens of separate analytics tabs for each platform.
Beyond Simple Data Collection
But a truly great dashboard does more than just throw numbers at you; it provides context and helps you piece together the story behind the data. It’s the difference between being handed a pile of ingredients and getting a recipe that shows you how to turn them into an amazing meal. By pulling all your metrics into one place, you can start asking bigger, more strategic questions—and get real answers.
This centralized view gives you the power to:
- Identify Top Performers: Instantly spot which channels, campaigns, or content formats are bringing in the best engagement and conversions.
- Track Growth Over Time: Keep an eye on follower growth, reach, and other key metrics to make sure your strategy is actually building momentum.
- Understand Your Audience: See what your followers truly connect with, helping you create more of the content they genuinely want.
- Justify Your Strategy: Create clear, visual reports that prove the value of your social media efforts to your boss or stakeholders.
A dashboard transforms raw data into a narrative that guides your entire strategy. It’s not just a reporting tool; it’s a decision-making engine that helps you connect social media activity to tangible business outcomes.
At the end of the day, an analytics social media dashboard is the bridge between activity and achievement. It gives you the clarity to stop guessing and start building a data-driven strategy that delivers measurable results. Instead of drowning in data, you’re empowered by it, ready to steer your social presence toward real, ROI-driven growth.
Decoding the Data Your Dashboard Should Track
A social media dashboard is only as good as the data it’s tracking. Just piling up numbers won't get you anywhere; you need to be watching the right metrics. Think of it like this: your metrics are the different instruments in an orchestra. Each one plays a unique part, but when you listen to them together, you get the full picture of your performance.
The best way to make sense of it all is to group your Key Performance Indicators (KPIs) into categories that line up with your actual business goals. This simple step keeps you from getting distracted by vanity metrics and forces you to focus on what’s actually moving the needle.
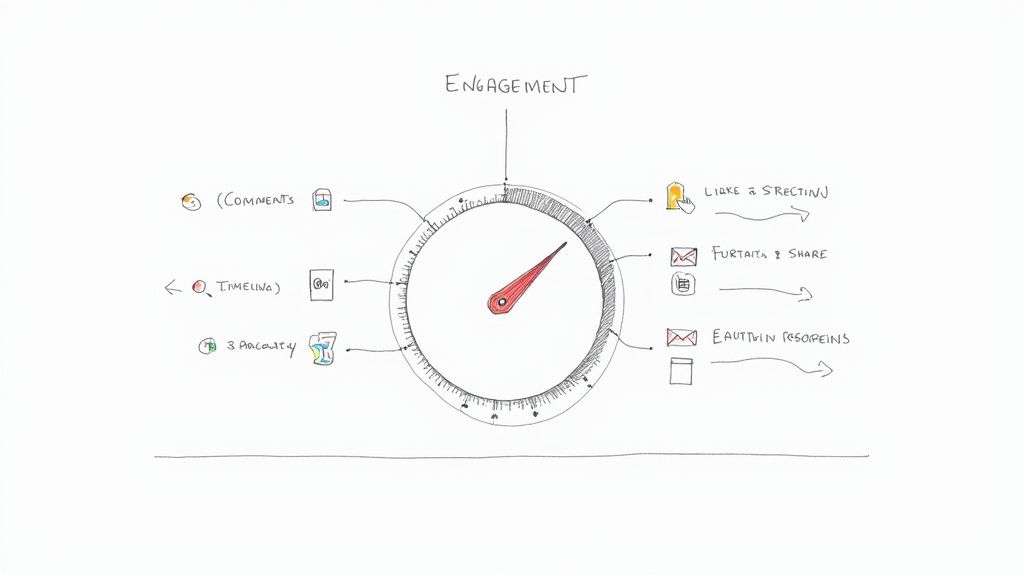
Engagement Metrics: The Heartbeat of Your Community
Engagement metrics are all about how your audience is interacting with what you post. These aren't just empty numbers—they represent real conversations, genuine connections, and the loyalty you're building. When engagement is high, it's a clear sign that your content is hitting the mark.
A few key engagement KPIs to watch:
- Likes and Reactions: The most straightforward feedback. It’s a quick nod of approval from your audience.
- Comments: This shows a deeper level of interest. Someone took the time to stop scrolling and share their thoughts.
- Shares and Retweets: This is gold. It means your content was so good that people wanted to broadcast it to their own friends and followers, turning them into advocates for your brand.
Keeping an eye on these helps you figure out which topics, post formats, and tones get people talking. If you want to go deeper, our guide on how to measure social media engagement can help you turn these numbers into a solid action plan.
Reach and Awareness Metrics: Expanding Your Footprint
While engagement tells you about the quality of your interactions, reach and awareness metrics are all about the quantity. These KPIs show you how many unique people are actually seeing your content and how well you’re growing your presence online. This is absolutely critical when your main goal is just getting your name out there.
You’ll want your dashboard to track impressions (how many times your content was shown) and reach (how many unique people saw it). When you look at these next to your follower growth rate, you start to see if your expansion is happening at a healthy, sustainable pace.
By 2025, social media platforms are projected to have over 5.66 billion users. The potential audience is staggering, and a great dashboard is what helps you cut through the noise of all that data to find a clear path for growth.
Conversion and Voice Metrics: Connecting Social to Your Bottom Line
At the end of the day, your social media work has to tie back to real business results. Conversion metrics are what connect your social activities to revenue, while customer voice metrics give you a raw, unfiltered look at how people perceive your brand.
Here’s what to track:
- Click-Through Rate (CTR): A simple measure of how many people who saw your post actually clicked the link inside it.
- Conversion Rate: The percentage of people who followed through on a specific action, like signing up for your newsletter or making a purchase.
- Brand Mentions: This tracks conversations about your brand, even when people don't bother to tag you. It's the digital equivalent of eavesdropping.
- Sentiment Analysis: This tells you the feeling behind the mentions—are people saying positive, negative, or neutral things?
For example, when you're working with a specific format like YouTube Shorts, you need a targeted approach. You can learn how to analyze YouTube Shorts performance with specialized guides that break down the unique metrics for that platform.
By organizing your dashboard around these distinct categories, you create a powerful tool that doesn’t just report on what happened last week—it shows you exactly where to go next.
To make this even clearer, here’s a breakdown of the most important metrics you should have on your dashboard.
Essential Metrics for Your Social Media Dashboard
This table breaks down the key performance indicators (KPIs) you need to track, what they actually measure, and why they’re so important for making smart decisions.
| Metric Category | Example KPI | What It Measures | Why It's Important |
|---|---|---|---|
| Engagement | Reply Rate | The percentage of mentions and comments that receive a reply from your team. | Shows how responsive and engaged your brand is with its community. High reply rates build loyalty. |
| Reach & Awareness | Impressions | The total number of times your content was displayed on screen. | Helps you understand the overall visibility of your content and brand awareness. |
| Conversions | Click-Through Rate (CTR) | The percentage of people who saw your post and clicked on a link in it. | Directly measures how effective your call-to-action is at driving traffic to your website or landing pages. |
| Customer Voice | Sentiment Analysis | The ratio of positive, negative, and neutral mentions of your brand. | Gives you a pulse on brand perception and helps you manage your reputation proactively. |
By keeping these KPIs front and center, your dashboard becomes less of a data dump and more of a strategic guide, helping you make informed decisions that actually contribute to your bottom line.
Building a Dashboard That Proves Real ROI
Let's be honest: vanity metrics like likes and follower counts feel good, but they don't pay the bills. If you want to secure a bigger budget and prove your team's value, you need a dashboard that speaks the language of business leaders. That means connecting social media activity directly to revenue.
The whole point is to build a dashboard that tells a clear story, from a single tweet or post all the way to a final sale. You’re essentially tracing the customer's journey to show exactly how your work impacts the bottom line. This isn't magic—it just requires setting up solid conversion tracking and putting a dollar value on key actions.
From Clicks to Conversions
First things first, you have to decide what a "conversion" actually means for your business. It's not always a direct purchase. A hugely valuable conversion could be a lead magnet download, a webinar sign-up, or a demo request.
Once you’ve defined your conversions, you can start assigning them an estimated monetary value. This is where you begin to quantify the real impact of your social campaigns.
For instance, if you know that one out of every ten demo requests eventually turns into a customer worth $5,000, then each sign-up is effectively worth $500. When you track that on your dashboard, the vague concept of "engagement" suddenly becomes tangible and financially relevant.
A dashboard built for ROI doesn't just report on what happened; it translates that activity into measurable financial impact. It moves the conversation from "we got 500 likes" to "this campaign generated $2,500 in qualified leads."
This flow chart shows how you can turn raw social data into strategic, ROI-focused decisions.
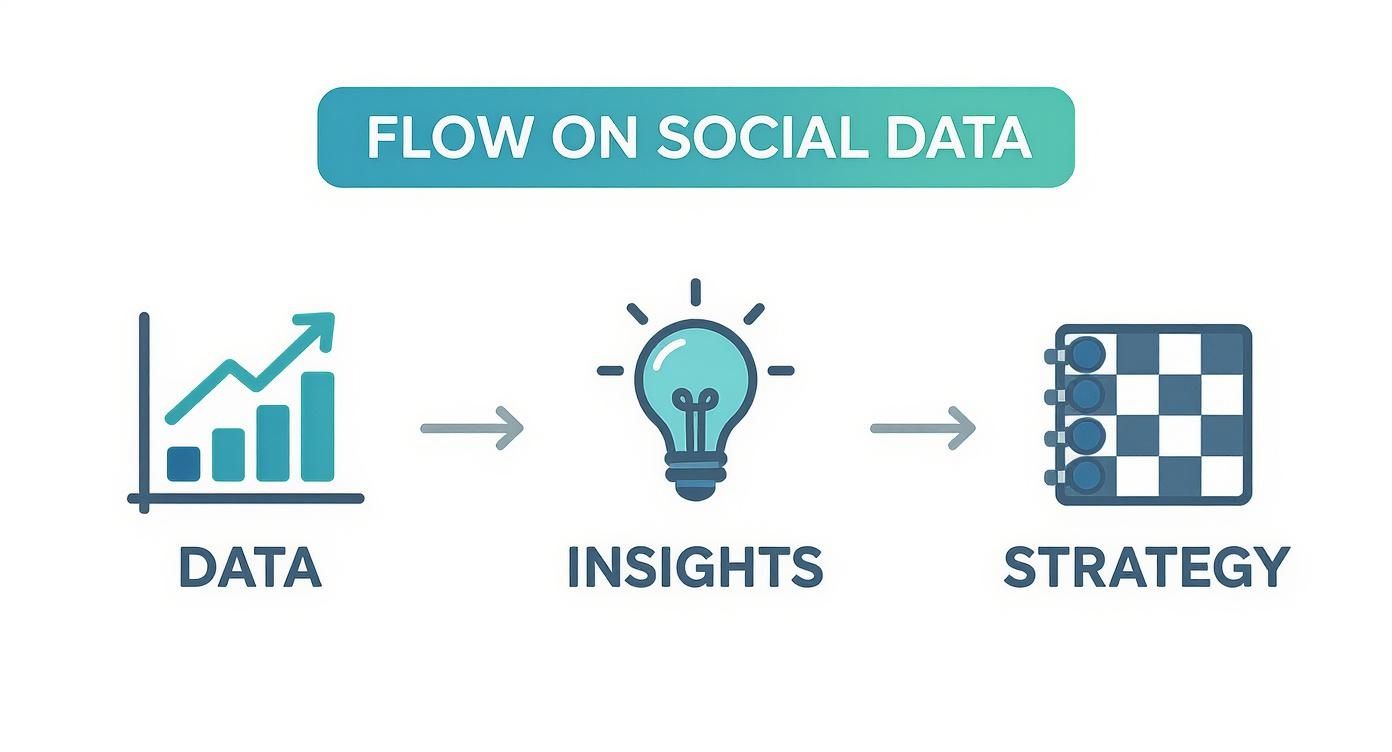
As you can see, a well-structured dashboard is what turns a bunch of isolated data points into a clear roadmap for growth.
Configuring Your Dashboard for Financial Clarity
To really hammer home the value of your work, plugging your numbers into a social media ROI calculator can provide undeniable financial insights. Your dashboard's job is to visualize this data effectively, showcasing not just what you spent, but what you earned.
To get this right, your ROI-focused dashboard absolutely needs widgets for:
- Conversion Tracking: How many people took a specific action (like signing up) after clicking a social media link?
- Cost Per Acquisition (CPA): What’s the average cost to land a new customer from a particular campaign?
- Return on Ad Spend (ROAS): For paid ads, this is crucial. It shows the revenue you generated for every single dollar spent.
- Assisted Conversions: This highlights how social media helped push a conversion forward, even if it wasn't the very last click in the customer's journey.
The pressure for this level of detail is only growing. The U.S. social commerce market is projected to hit a staggering USD 80 billion by 2025. That means more and more businesses will demand real-time dashboards that can attribute sales directly to specific social campaigns.
Ultimately, building a dashboard that proves ROI is about creating a single source of truth for your team's financial impact. For a detailed guide on the formulas and framework, check out our post on how to calculate marketing ROI. This is how you transform social media from a perceived cost center into a documented revenue driver.
Turning Raw Data into Strategic Decisions
A social media dashboard packed with charts and numbers looks impressive, but it’s essentially worthless if you don't know how to read the story it's telling. Raw data is just noise. The real magic happens when you turn that information into a clear narrative that informs your next move. This is the crucial leap from simply watching metrics to asking the kind of strategic questions that actually drive growth.

Start thinking like a detective. A sudden spike in negative sentiment isn't just a number—it's a clue. Your job is to use the dashboard to dig into the "why." Did a recent product update backfire? Is a competitor running a new campaign that pokes at one of your weak spots? Answering these questions turns a potential fire drill into a genuine opportunity to improve.
From Observation to Action
The first step toward making smarter decisions is learning to spot meaningful patterns and, just as importantly, the anomalies. Your dashboard should immediately flag when a metric veers off-course from its usual baseline. For instance, a sudden nosedive in engagement on your Instagram Stories isn't something to ignore; it needs a diagnosis.
By digging into your dashboard, you can start cross-referencing this drop with other data points:
- Content Type: Did you recently switch from interactive polls to posting only videos?
- Posting Time: Was this story posted at a different time of day than usual?
- Topic: Did you cover a subject that might be less interesting to your core audience?
This process helps you form educated guesses—hypotheses—that you can then go on to test. Maybe your audience is way more active in the evening. Your dashboard is the perfect place to run A/B tests to see if that’s true, helping you fine-tune your posting schedule for maximum impact.
The goal is to move beyond passive reporting. An effective analytics social media dashboard empowers you to ask "What if?" and then provides the data to find the answer. It’s the engine for continuous improvement.
Allocating Resources with Confidence
One of the biggest wins from a well-interpreted dashboard is the ability to shift your budget and team's effort with complete confidence. If your data clearly shows that LinkedIn drives 80% of your qualified B2B leads while X (formerly Twitter) is only bringing in 5%, you have a rock-solid, data-backed reason to reallocate your resources.
But it’s not just about cutting what isn't working; it’s about doubling down on what is. When you identify your top-performing channels and content formats, you can invest more heavily in the areas that actually deliver results. For example, the Replymer dashboard gives you a granular view by letting you track performance by keyword and platform. This helps you see exactly where your conversational marketing efforts are generating the most measurable ROI.
Ultimately, your analytics social media dashboard is your strategic compass. It helps you find your way through the noisy, complex world of social media, avoid costly mistakes, and set a direct course toward your business goals. It ensures every decision you make is informed, intentional, and built to have an impact.
Choosing the Right Analytics Dashboard for Your Business
Picking a social media analytics dashboard can feel like you're standing in front of a giant wall of tools, unsure which one to grab. You’ve got everything from the basic tools built right into the social platforms to massive, all-in-one software suites. The trick is to tune out the marketing buzz and zero in on what your business actually needs.
Let’s be realistic: a freelance social media manager doesn't need the same heavy-duty dashboard as a global enterprise. Your decision should come down to three simple things: your team's size, your budget, and what you’re trying to achieve. Before you even look at a demo, ask yourself what you need this tool to do. Are you tracking high-level ROI for the leadership team, or are you in the weeds, tweaking ad copy and post times every day?
Evaluating Key Dashboard Features
Once you have a shortlist, it's time to pop the hood and see what’s really running the show. A slick design is nice, but the real value is in the features that help you make smarter decisions. Don't get distracted by a dozen flashy charts that look impressive but don't actually tell you anything useful.
Instead, focus on the functions that will make a real difference in your day-to-day work:
- Essential Integrations: Does the dashboard play well with the other tools you already use, like your CRM or email platform? If not, you're just signing up for more manual data entry.
- Reporting and Customization: Can you build reports that actually show the metrics your boss or client cares about? Cookie-cutter reports rarely tell the whole story.
- User Interface (UI) and Usability: Is the dashboard easy to navigate? If your team has to fight with it, they'll just stop using it, and your investment goes down the drain.
A great dashboard shouldn't feel like a chore. It should be an intuitive partner that helps you connect the dots, making complex data simple and actionable.
The demand for these tools is exploding. The global social media analytics market was valued at around USD 14 billion in 2024 and is expected to balloon to USD 83.11 billion by 2033. This growth just highlights how critical it is to find a tool that truly fits your needs.
Matching the Tool to Your Team and Goals
There's no single "best" analytics social media dashboard—only the one that’s best for you. If you're just starting out, the free analytics from Meta or LinkedIn might be all you need. But as your strategy and team grow, you'll hit a ceiling and require something more powerful.
This is where you'll find different types of dashboards designed for different needs.
Comparison of Social Media Analytics Dashboard Types
To make sense of the options, let's break down the main categories. Each type of dashboard serves a different purpose, from basic monitoring to deep, comprehensive analysis. This table can help you pinpoint which solution aligns best with your team's goals and resources.
| Dashboard Type | Key Features | Best For | Cost |
|---|---|---|---|
| Native Platform Analytics | Basic metrics (reach, likes, followers), post-level data, simple audience demographics. | Solopreneurs, small businesses, or those just starting with social media. | Free |
| All-in-One Suites | Scheduling, listening, analytics, and reporting in a single platform. | Mid-to-large businesses and agencies managing multiple accounts and campaigns. | $$-$$$ |
| Specialized Analytics Tools | Deep-dive analytics, competitive analysis, trend spotting, advanced reporting. | Data-driven marketing teams focused on specific goals like competitor tracking or ROI. | $$-$$$ |
| ROI-Focused Platforms | Connects social actions to business outcomes (e.g., leads, sales), tracks reply rates, and conversation impact. | Businesses laser-focused on proving the direct financial value of social media. | $$-$$$ |
Ultimately, your choice depends on your strategic priorities. Are you focused on brand awareness, or are you driving measurable business results?
For instance, all-in-one platforms like Replymer are built for businesses that need to connect the dots between conversation and conversion. It moves beyond vanity metrics to track things like reply rates and keyword performance, linking your social efforts directly to ROI. For a closer look at how different tools stack up, our social listening tools comparison provides a helpful breakdown.
Your final decision should be about empowerment. The right dashboard will give your team the clarity they need to move from just looking at data to taking meaningful action—refining content, understanding your audience better, and proving the undeniable impact of social media on the bottom line.
Got Dashboard Questions? We've Got Answers.
Diving into social media analytics can feel a bit overwhelming at first. It's a world filled with charts, graphs, and acronyms, and it's not always obvious how all the pieces connect. Let's clear up some of the most common questions people have. Think of this as your quick-start guide to understanding your dashboard and using it with confidence from the get-go.
Getting these fundamentals right is what turns a simple reporting tool into a command center for making smarter, faster decisions.
Analytics vs. Reporting: What's the Difference, Really?
This one trips up a lot of people. The easiest way to think about it is to imagine a visit to the doctor.
Reporting is like the nurse taking your vitals. You get the raw numbers: your temperature, your blood pressure, your heart rate. In social media terms, this is your 10,000 impressions or 500 likes. It's a straightforward snapshot of what happened. It’s pure data.
Analytics, on the other hand, is the doctor’s diagnosis. It’s the part where they look at those numbers and tell you why they matter and what to do next. For example, "Your engagement is down, and it looks like it's because your video content isn't landing with your audience like it used to." A great dashboard gives you both—the numbers and the context to make sense of them.
Reporting tells you what happened. Analytics explains why it happened and guides you on what to do next. Your dashboard should bridge that gap, turning raw data into real intelligence.
The distinction matters because a dashboard that only reports leaves all the hard work to you. A true analytics platform helps you connect the dots and see the story your data is telling.
How Often Should I Actually Check This Thing?
There’s no magic number here. How often you check your dashboard really comes down to your role and what you’re trying to achieve. The goal is to stay informed without getting bogged down in the numbers.
Here’s a simple rhythm that works for most teams:
- Daily Check-ins (5-10 minutes): This is for the front-line folks, like community managers. A quick scan of brand mentions, comment spikes, and DMs is crucial for staying on top of conversations and protecting your brand's reputation.
- Weekly Reviews (about 30 minutes): Perfect for campaign managers and content creators. Looking at the data weekly helps you see what's working with your content, track campaign progress, and make small tweaks to improve performance before it's too late.
- Monthly or Quarterly Deep Dives (1-2 hours): This is for big-picture strategy. Marketing leads and executives use this time to review long-term trends, follower growth, and, most importantly, the financial return on your social media efforts.
A well-designed dashboard makes each of these check-ins quick and to the point, so you can grab the insights you need and get back to work.
Can I Build a Dashboard for Free?
You absolutely can. It’s possible to stitch together a basic analytics social media dashboard using free tools like Google Sheets or Looker Studio. The process involves manually downloading reports from each platform (like Meta Business Suite or X Analytics) and then plugging that data into your own spreadsheet.
This DIY approach is a great way to start if you're on a tight budget. But it comes with one major downside: your time. Manually pulling data is slow, it's easy to make mistakes, and you’re never looking at what’s happening in real-time.
As your social media presence grows, you'll quickly find that a dedicated tool is worth the investment. Automated platforms do the tedious work for you, pulling data from all your channels into one place. They also offer more advanced insights, like sentiment analysis and competitive tracking, giving you the complete, up-to-the-minute view you need to make smart moves quickly.
Ready to stop wrestling with spreadsheets and start seeing real ROI? Replymer gives you a clear, powerful dashboard to track every mention, reply, and keyword, so you can turn conversations into measurable growth. See how it works.


